
The 3% Lever: Weekly Shifts That Compound Into $100K+ Over 12 Months for $75K–$95K Operators
The Clear Edge OS 3% Lever System for $100K‑month founders who map their five numbers, rotate one improvement per month, and let small, trackable lifts compound into multi‑X growth.


The Executive Summary
$100K-month founders risk leaving $60K+ in monthly upside by chasing breakthroughs while the 3% Lever quietly compounds gains across five core numbers.
Who this is for: Data-driven founders and operators around $97K–$113K/month who track leads, conversion, deal size, retention, and capacity but keep reaching for new offers and launches instead of small 3% moves.
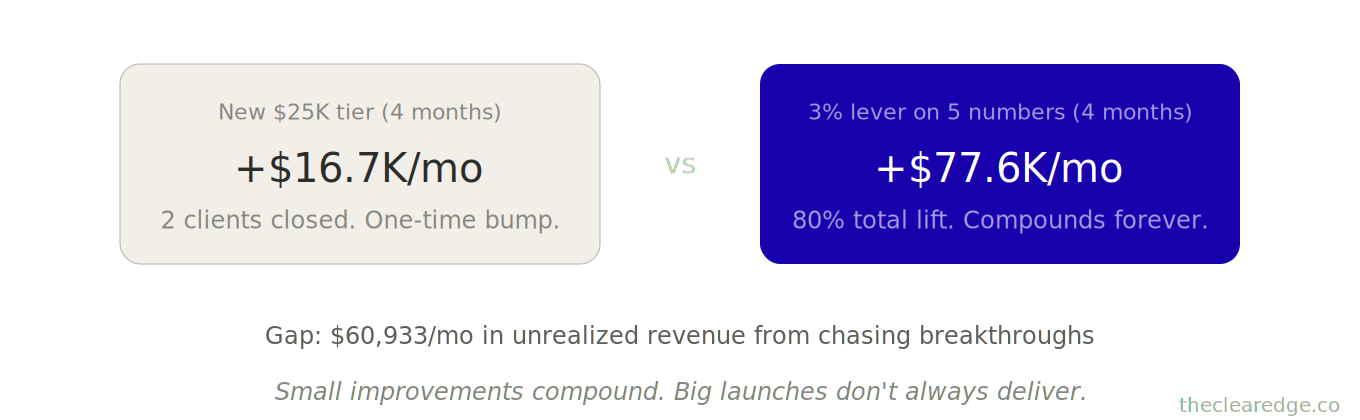
The breakthrough trap problem: A $97K/month founder spent four months on a $25K tier that added $16,667/month (17%), while a 3% monthly lift across five numbers could’ve pointed toward about $174,600/month (80% gain), leaving roughly $60,933 in upside untouched.
What you’ll learn: The 3% Lever System to map your five numbers, surface 3–15% wins in each, rotate one improvement per month, and watch the multiplier that moved businesses from $100K → $292K in 12 months and $102K → $421K in 18 months without new offers.
What changes if you apply it: You stop rebuilding every quarter and use 3–5 hours monthly to ship one improvement at a time, creating moves like $109K → $214K in 5 months and a tracked 4.1X jump over 18 months while workload stays flat and compounding carries the weight.
Time to implement: A one-time 4–5 hours to build your dashboard and opportunity pipeline, then 4–5 hours monthly to run the ritual, enough to shift from 1.5–2.5X launch-driven growth to 3–9X compounding over 18–24 months without changing markets or products.
Written by Nour Boustani for $100K-month founders and operators who want 3–9X growth from small, predictable 3% improvements instead of risky “big swing” launches that rarely deliver.
Seeing 40–70% upside sitting in your five core numbers at $100K/month is a Breakthrough Trap signal; pair the 3% Lever with The Clear Edge OS and upgrade to premium to run it like a system.
› Library Navigation: Quick Navigation · The Clear Edge OS
The Breakthrough Trap At $100K Month Revenue
From the outside, this founder’s $100K/month business looked like it had cleared the first big hill. Inside the numbers, she was quietly burning through upside she’d already earned.
Her $97K/month service business makes it obvious. She spent four full months crafting a premium $25K tier—high-end positioning, new messaging, a polished sales page, launch machinery.
She closed 2 clients in the first 90 days: $50K total, $16,667/month, a 17% lift that looked fine on paper but barely nudged her ceiling. The revenue ceiling didn’t come from lack of demand; it came from rebuilding the front of the house while the five core numbers stayed frozen.
All that extra effort padded the top line on slides while the real compounding sat untouched in her base numbers.
Real growth engine (unchanged):
68 monthly leads
34% conversion
$4,200 average transaction
9 months retention
Capacity for 28 clients with 23 already in
That’s where the compounding sat while she chased a breakthrough.
If she’d improved each number by 3% monthly for those same four months while maintaining the existing offer:
Month 1: All five numbers improve 3% each
Month 2: Another 3% improvement each (compounding on month 1)
Month 3: Another 3% (compounding on months 1–2)
Month 4: Another 3% (compounding on months 1–3)
Compound math:
(1.03)^4 = 1.1255 — a 12.55% improvement per number over 4 months.
Applied across five numbers: 1.1255^5 = 1.8 → about an 80% total revenue increase.
On her $97K/month base, $97K × 1.8 = $174,600/month, compared to her actual $113,667/month with the new tier.
Difference: $60,933 in unrealized monthly revenue from chasing a breakthrough instead of optimizing fundamentals.
The pattern: founders at $100K spend months building new things while leaving 40–70% revenue upside untouched in their core numbers.
Small improvements compound. Big launches don’t always deliver.
The $60,933 gap sets the stakes; now we’ll zoom out into the compound math that makes those 3% monthly moves beat any one-off launch over 12–18 months.
3% Lever Compound Math For $100K Month Businesses
Here’s why 3% monthly improvements matter more than breakthrough thinking:
Take a business at $100K/month with these numbers:
Lead Flow: 80 leads/month
Conversion: 30%
Transaction Value: $4,200
Retention: 10 months average
Capacity: 30 clients (currently 24)
Revenue formula: (lead flow × conversion rate) × average transaction value = monthly revenue.
For this case: (80× 0.30) × $4,200 = $100,800/month.
Now improve each by 3% monthly for 12 months
After Month 12:
Lead Flow: 80 × (1.03^12) = 114 leads/month (+43%)
Conversion: 30% × (1.03^12) = 42.8% (+42.7%)
Transaction Value: $4,200 × (1.03^12) = $5,989 (+42.6%)
Retention: 10 months × (1.03^12) = 14.3 months (+43%)
Capacity expands to match demand when you add people or systems (via delegation systems from The Delegation Map, The 30-Hour-Week), so it doesn’t compound smoothly by 3% each month—it increases in bigger jumps whenever you make a structural change.
New revenue: (114 × 0.428) × $5,989 = $292,298/month
$100K → $292K in 12 months is 192% growth driven purely by 3% monthly improvements.
It’s not a 10X jump, but it’s still close to 3X growth while you keep the same offers and stay in the same market.
Here’s where it gets interesting: if you sustain 3% monthly improvements for 18 months:
(1.03^18) = 1.7024 per number
1.7024^5 = 14.4X total multiplier (across five numbers)
$100K × 14.4 = $1,440K/month
That’s the 10X number. It takes 18 months of consistent 3% improvements, not 12, but the math holds.
Most founders never run this calculation; they chase 30% jumps through new launches while leaving quiet 3% improvements untouched every month.
The compound effect is simple: 3% monthly, sustained over quarters, beats a single 30% spike.
[3% Monthly vs 30% Once]

3% every month
--> small lift
--> small lift
--> small lift
=> big compounding jump

---

30% once
--> spike
--> flat line
Once you see how 3% compounds, the next move is to find your own 3–15% pockets in each number instead of guessing where the upside lives.
Move 1: Identify 3% Revenue Opportunities In Five Core Numbers
Before you can improve by 3%, you need to know where 3% improvement is possible in each number.
Not every number has easy 3% gains—some require structural changes, others need minor tweaks—so start with the lowest-hanging opportunity in each of the five.
Lead Flow (+3%)
Add one new lead source (new channel)
Double down on the best existing channel (optimization)
Launch one strategic partnership (leverage)
Implement one referral incentive (activation)
Conversion (+3%)
Improve sales page copy (positioning)
Add social proof element (trust)
Implement urgency mechanism (decision trigger)
Refine qualification process (better fit)
Transaction Value (+3%)
Add value-stack element (bundling)
Test pricing increase (market test)
Introduce payment plans (access)
Upsell during onboarding (expansion)
Retention (+3%)
Improve the first 30 days’ experience (onboarding)
Add mid-engagement check-in (intervention)
Create continuation offer (next step)
Fix one common drop-off point (retention repair)
Capacity (+3%)
Delegate one client-facing task (team capacity)
Systemize one delivery component (efficiency)
Batch one recurring activity (time creation)
Automate one manual process (scale unlock)
A coaching business at $105K/month mapped her opportunities:
Lead Flow: Currently 92/month.
Opportunity: launch podcast (new channel).
Estimated: +6 leads monthly = +6.5%.
Conversion: Currently 28%.
Opportunity: add a video testimonial to the sales page.
Estimated: 28% → 31% = +10.7%.
Transaction Value: Currently $4,100.
Opportunity: introduce a 12-month payment plan (vs. the current 6-month).
Estimated: $4,100 → $4,600 = +12.2%.
Retention: Currently 8.5 months.
Opportunity: add a 90-day check-in call.
Estimated: 8.5 → 9.2 months = +8.2%.
Capacity: Currently 26 clients, max 28.
Opportunity: delegate intake calls.
Estimated: max increases to 32 = +14.3%.
She didn’t need 3% improvements; she had 6–14% opportunities sitting untapped across all five numbers.
Most founders at $100K have 5–20% quick wins available in at least three of the five numbers—they just never map them.
Map your opportunities first, rank them by implementation speed, and pick the fastest win in each number.
[3% Opportunity Scan]

Lead Flow      --> 1 small move
Conversion     --> 1 small move
Transaction    --> 1 small move
Retention      --> 1 small move
Capacity       --> 1 small move
With the opportunity map in place, the question becomes how to turn those 3–20% gains into a simple month-by-month rhythm the team can actually run.
Move 2: Implement One 3% Improvement Per Number Each Month
Once you have your opportunity map, you implement systematically—one improvement per number, every month.
You don’t push all five at once; you improve one number at a time, rotating through the five.
Month 1: Improve Lead Flow
Month 2: Improve Conversion
Month 3: Improve Transaction Value
Month 4: Improve Retention
Month 5: Improve Capacity
Month 6: Return to Lead Flow (next opportunity)
This creates a rhythm: you’re always improving something, never overwhelming the business with changes.
An agency at $109K/month implemented this rotation:
Month 1 (Lead Flow):
Added LinkedIn content system. +8 qualified leads monthly.
Lead flow: 71 → 79 (+11.3%).
Month 2 (Conversion):
Rebuilt proposal template with ROI calculator.
Conversion: 36% → 41% (+13.9%).
Month 3 (Transaction Value):
Introduced project retainer model.
Average deal: $6,800 → $7,900 (+16.2%).
Month 4 (Retention):
Added quarterly business review.
Retention: 11 months → 13 months (+18.2%).
Month 5 (Capacity):
Hired a junior account manager.
Capacity: 16 projects → 21 projects (+31.3%).
Revenue progression:
Month 0: $109K
Month 1: $121K (lead flow improvement)
Month 2: $138K (conversion improvement compounding)
Month 3: $161K (transaction value improvement compounding)
Month 4: $187K (retention starting to impact)
Month 5: $214K (capacity unlocked, all improvements compounding)
$109K → $214K in 5 months = 96% growth.
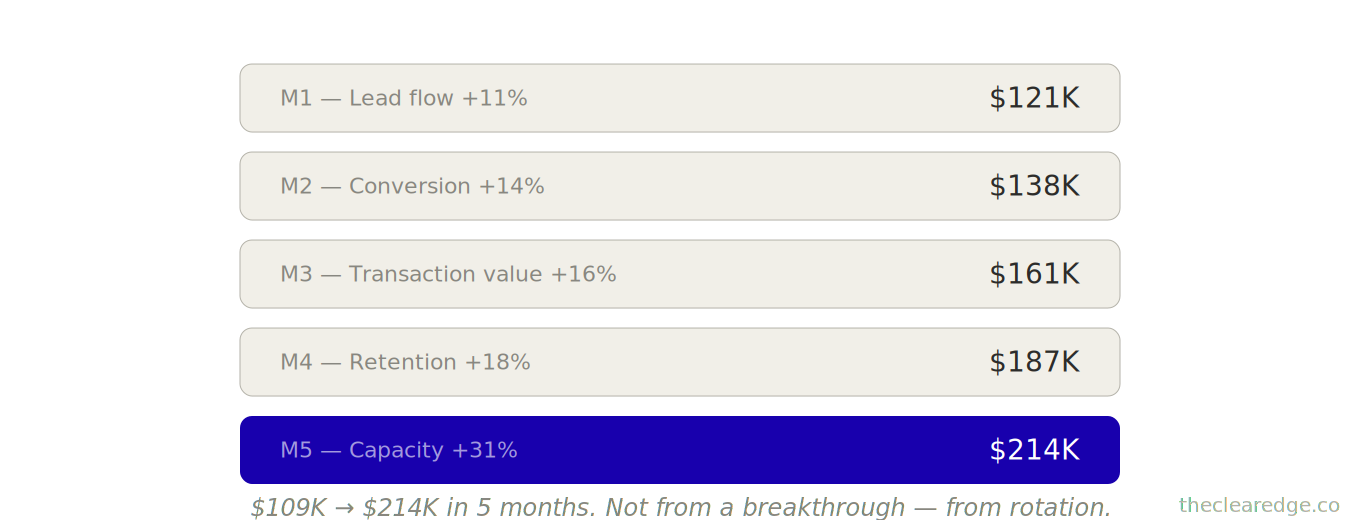
Not from a breakthrough. From systematic improvement of core numbers.
The pattern is simple: most improvements take 2–4 weeks to implement and another 4–8 weeks to show their full impact.
By rotating focus monthly, you’re always 1–2 improvements ahead of the revenue that’s still catching up.
Implement one improvement per month and let compounding do the work.
[Monthly 3% Rotation]

- Month 1  --> Lead Flow
- Month 2  --> Conversion
- Month 3  --> Transaction
- Month 4  --> Retention
- Month 5  --> Capacity
- Month 6  --> Back to Lead Flow
From Understanding The 3% Lever To Running It Monthly
You now understand the 3% Lever and how the five numbers compound. If you want help running this every month, premium gives you the templates and guardrails.
You’ve seen how a $109K → $214K path looks in practice; next is tracking how each change quietly multiplies through the rest of the system over weeks and months.
Move 3: Track The 3% Lever Multiplier Effect Across Your System
As you improve each number, the real leverage comes from tracking how improvements multiply across the system.
Most founders improve one number and only measure that number’s impact. They miss the cascade effect that change has on the rest of the system.
When you improve lead flow by 10%, conversion rate typically shifts 2–4% at the same time because more leads allow for better qualification and a higher close rate.
When you improve transaction value by 15%, retention often improves 3–6% because clients paying more are more invested and stay longer.
When you increase capacity by 20%, lead flow pressure decreases because you can be more selective, attract better-fit clients, and raise conversion rates.
The five numbers aren’t isolated. They’re connected. Improve one, others shift.
A course creator at $113K/month tracked her multiplier:
Primary improvement: Transaction value $3,800 → $4,900 (+29%)
Cascade effects:
Retention improved 7.5 → 8.8 months (+17.3%) without intervention (higher price → more commitment).
Conversion dropped slightly, 39% → 37% (-5.1%) as some price-sensitive leads filtered out.
Lead quality improved (completion rate: 68% → 79%).
Net effect: $113K → $142K/month (+25.7%).
Expected from transaction value alone: +29% → $146K.
Actual: $142K (conversion drop offset by retention gain).
She didn’t lose revenue from the conversion drop—retention gain more than compensated.
The multiplier math: when you improve intelligently, you get 0.7–1.4X the expected impact because other numbers adjust (sometimes positively, sometimes negatively).
Track the cascades. They tell you whether you’re improving the right things.
24-Month Revenue Impact Of 3% Monthly Improvements
Here’s what sustained 3% monthly improvements look like over 24 months:
Starting point: $100K/month
After 12 months:
Theoretical: 8.1X
Realistic: 2.8–3.5X
Revenue range: $280K–$350K/month
After 18 months:
Theoretical: 14.4X
Realistic: 4.2–5.8X
Revenue range: $420K–$580K/month
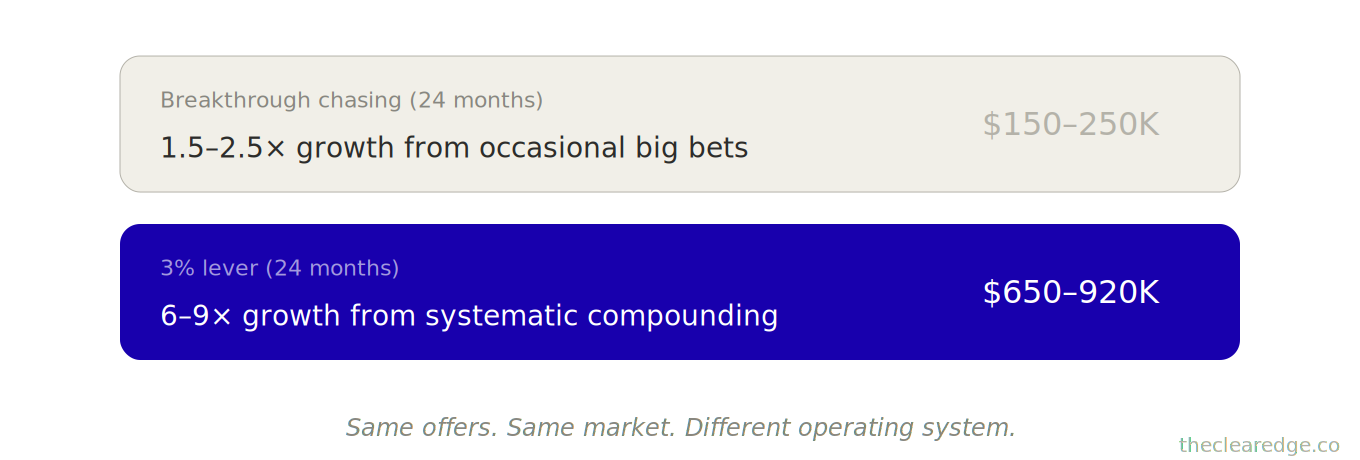
After 24 months:
Theoretical: 25.6X
Realistic: 6.5–9.2X
Revenue range: $650K–$920K/month
Why the gap between mathematical and realistic multipliers?
Implementation friction: Not every improvement works on the first try; some need 2–3 iterations before they stick.
Market constraints: Lead flow doesn’t infinitely scale at the same quality.
Operational limits: Capacity expansion requires delegation/hiring (not instant).
Diminishing returns: First 3% improvements are easier than later 3% improvements.
But even at realistic multipliers, you’re looking at 6–9X revenue in 24 months without building new products, entering new markets, or chasing breakthrough ideas.
A service business tracked this over 18 months:
Month 0: $102K
Month 6: $156K (+53%)
Month 12: $248K (+143%)
Month 18: $421K (+313%)
4.1X in 18 months. Not the mathematical 14.4X, but well above the 2–3X most founders achieve by chasing launches.
The 24-month view: sustained small improvements beat occasional big bets.
Those 24-month ranges only matter if you’re willing to change how you work week to week, so let’s get specific about the ritual and cost of running the 3% Lever.
What The 3% Lever Changes And What It Costs To Run
Shifting from breakthrough thinking to compound improvement requires three changes:
1. Monthly Improvement Ritual
Block 3–4 hours monthly to identify and implement one improvement in your current focus number.
Takes 3–4 hours monthly (fits within fence time from The Time Fence).
2. Tracking Dashboard
Update your five numbers monthly (from The Five Numbers).
Add trend lines to see compound effects.
Takes 45 minutes to build, 15 minutes monthly to update.
3. Opportunity Pipeline
Maintain a running list of 3–5 improvements per number so you’re never starting from zero.
Takes 90 minutes to build initially, 20 minutes monthly to refresh.
Total setup: 4–5 hours, one-time investment.
Monthly maintenance: 4–5 hours (improvement implementation + tracking).
Upside range: 3–9X over 18–24 months.
Default path: 1.5–2.5X if you keep working the way you are now.
For a founder at $100K/month, that’s $200K–$800K in additional monthly revenue over 24 months from systematic optimization vs. reactive opportunity-chasing.
One founder’s feedback after 12 months: “I stopped looking for the next big thing and started optimizing what I had. Revenue tripled. Effort stayed the same.”
When Breakthrough Chasing Gets Expensive
Leaving $60,933 a month on the table to protect your next big launch is the quiet tax on avoiding 3% work; pick one number and start paying that down.
Run Your 3% Lever Quick-Gate Checklist
Next time you’re about to spin up a new offer, tier, or launch, run these gates on your five numbers first.
☐ Listed current five numbers (lead flow, conversion, transaction value, retention, capacity) with today’s actuals pulled from your Five Numbers dashboard.
☐ Logged at least one 3–15% opportunity for each number, tagged by implementation speed and expected revenue lift.
☐ Scored which number is your current bottleneck using The Five Numbers constraint test, marked it as this month’s 3% Lever focus.
☐ Compared your planned “breakthrough” move against a 3% monthly lift across all five numbers and wrote the projected 12–18 month revenue difference.
☐ Marked a binary decision in writing: run the 3% Lever on this month’s focus number now or consciously accept the $60,933+ upside gap.
Every time you run this, you cut the $60,933/month Breakthrough Trap tax before it compounds across the next 12–18 months.
How To Start Running The 3% Lever This Month
Start running the 3% Lever this month by choosing one core number, making a single 3–5% improvement, and letting that small win start compounding over the next 8–12 weeks.
Map your 3% opportunities in each of the five numbers. Where’s the lowest-hanging improvement in lead flow, conversion, transaction value, retention, and capacity?
Implement one improvement this month. Pick your biggest constraint (from The Five Numbers) and make it 3–5% better.
Start the rotation. Month by month, improve one number while maintaining the others. Let compounding do the work.
The shift from breakthrough-chasing to compound-building typically shows measurable impact within 8–12 weeks. First improvements compound, second improvements stack, momentum builds.
FAQ: 3% Lever System For $100K Month Founders
Q: How do I know if the 3% Lever is right for my $100K business?
A: It’s right for you if you’re around $97K–$113K/month, already track leads, conversion, deal size, retention, and capacity, and keep chasing new offers or launches instead of small optimizations.
Q: How does the 3% Lever turn tiny improvements into 3–10X revenue without new offers?
A: By improving each of your five core numbers by about 3% per month, you can compound a $100K/month business toward roughly $292K in 12 months. Over 18–24 months, sustained gains push into 4–9X growth.
Q: How much upside did the $97K founder lose by chasing a breakthrough instead of running 3% improvements?
A: She spent four months building a $25K premium tier that added $16,667/month (17%), while 3% monthly gains across her five numbers could have taken her to about $174,600/month—leaving $60,933 in unrealized monthly revenue.
Q: How do I map my own 3% opportunities across the five numbers?
A: You start by writing down current lead flow, conversion, transaction value, retention, and capacity, then identify low-effort moves in each—like a new channel, a better testimonial, a modest price test, a 90-day check-in, or a simple delegation—that can create 3–15% lifts per number.
Q: How do I run the monthly rotation so improvements compound instead of overwhelming the team?
A: You focus on one number per month—lead flow in Month 1, conversion in Month 2, transaction value in Month 3, retention in Month 4, capacity in Month 5, then repeat—so you’re always improving something while each change gets 4–8 weeks to show full impact.
Q: What kind of short-term results has a real agency seen from using the 3% Lever rotation?
A: One agency moved from $109K to $214K in five months by sequentially improving lead flow (+11.3%), conversion (+13.9%), transaction value (+16.2%), retention (+18.2%), and capacity (+31.3%), without launching anything new.
Q: How do I track the multiplier effect so I see the true impact of each change?
A: You keep a simple Five Numbers dashboard, update it monthly, and watch for cascades—for example, a 29% price increase that also lifts retention from 7.5 to 8.8 months and nudges completion rates from 68% to 79%, even if conversion dips slightly.
Q: What realistic revenue range can I expect over 18–24 months from consistent 3% improvements?
A: With implementation friction and real-world limits, the article shows founders moving from $100K to roughly $280K–$350K in 12 months and toward $420K–$580K in 18 months, with 24-month ranges around $650K–$920K instead of the theoretical 25.6X.
Q: How much time does it take to set up and run the 3% Lever each month?
A: It takes about 4–5 hours once to build your dashboard and opportunity pipeline, then roughly 4–5 hours per month to choose and ship one improvement and update your numbers.
Q: Why does the 3% Lever beat big launches for most $100K founders?
A: Because 3–5 hours of monthly optimization can reliably stack 3–9X growth over 18–24 months, while “big swing” launches often deliver only 1.5–2.5X gains, burn months of build time, and leave 40–70% upside sitting untouched in your core numbers.
Up Next: The Offer Stack System For Parallel Revenue
Next article covers “The Offer Stack: Turn Expertise Into $10K Monthly Passive Income for $90K–$110K Operators.” I will show you how to build parallel revenue without adding operational complexity.
Navigate The Clear Edge OS Systems for Scaling From $5K to $150K
Start here: The Complete Clear Edge OS — Your roadmap from $5K to $150K with a 60-second constraint diagnostic.
Use daily: The Clear Edge Daily OS — Daily checklists, actions, and habits for all 26 systems.
LAYER 1: SIGNAL (What to Optimize)
The Signal Grid • The Bottleneck Audit • The Five Numbers
LAYER 2: EXECUTION (How to Optimize)
The Momentum Formula • The One-Build System • The Revenue Multiplier • The Repeatable Sale • Delivery That Sells • The 3% Lever • The Offer Stack • The Next Ceiling
LAYER 3: CAPACITY (Who Optimizes)
The Delegation Map • The Quality Transfer • The 30-Hour Week • The Exit-Ready Business • The Designer Shift
LAYER 4: TIME (When to Optimize)
Focus That Pays • The Time Fence
LAYER 5: ENERGY (How to Sustain)
The Founder Fuel System • $100K Without Burnout
INTEGRATION & MASTERY
The Founder’s OS • The Quarterly Wealth Reset
AMPLIFICATION (AI & Automation)
The Automation Audit • The Automation Stack
⚑ Found a Mistake or Broken Flow?
Use this form to flag issues in articles (math, logic, clarity) or problems with the site (broken links, downloads, access). This helps me keep everything accurate and usable. Report a problem →
› More to Explore: Quick Navigation · The Clear Edge OS
➜ Help Another Founder, Earn a Free Month
If this system just saved you from leaving $60,933 in monthly upside chasing “breakthroughs,” share it with one founder who needs that relief.
When you refer 2 people using your personal link, you’ll automatically get 1 free month of premium as a thank-you.
Get your personal referral link and see your progress here: Referrals
Get The 3% Lever Implementation Toolkit And Library Access
You’ve read the system. Now implement it.
Premium gives you:
Ready-to-use PDF toolkit—every template, diagnostic, and formula pre-filled, zero setup, immediate use
Plug-and-play AI diagnosis sessions—drop into Claude, Gemini or ChatGPT, answer a few questions, save hours of guessing, get your exact next move
Audio key points—concentrated frameworks you can absorb in minutes, implement while you move
Unrestricted access to the complete library—every system, every update
What this prevents: Leaving 40–70% revenue upside untouched while chasing big launches instead of 3% monthly gains.
What this costs: $12/month. The 3% Lever tools ship with this article.
Download everything today. Implement this week. Cancel anytime, keep the downloads.
Already upgraded? Scroll down to download the PDF, audio, and your AI session.
