
The 5-Layer Problem Analysis: How to Find What's Broken When You're Stuck at $60K–$120K per Month
For founders, consultants, and operators at $40K–$90K/month, this 5-layer strategic analysis system turns recurring revenue, team, and margin issues into precise, structural fixes that compound.


The Executive Summary
Founders, consultants, and operators at $40K–$90K/month keep fighting the same fires because they fix symptoms; a 5-layer strategic analysis reveals the real root problems so small, precise fixes stop repeating.
Who this is for: Founders, consultants, and agency operators between $40K–$90K/month with recurring issues—flat $45K revenue, surprise resignations, margin compression, burnout—despite constantly “solving problems.”
The strategic analysis problem: Surface fixes like more leads, new hires, or price tweaks burn dozens of hours and $7,000+ per cycle while the same 6–12 problems regenerate.
What you’ll learn: The 5-Layer Strategic Analysis Framework (Surface Symptom, Immediate Cause, Root Cause, Leverage Points, Consequences) plus scoring and consequence mapping that turn vague issues into precise, high-ROI interventions.
What changes if you apply it: You collapse 8 visible problems into 2 root causes, make one move that unlocks shifts like $45K to $61K to $68K/month, and stop fixing the same issue twice.
Time to implement: Invest 4–6 hours for one full 5-layer analysis, then 30–60 minutes per problem over 4–8 weeks to build a strategic analysis database that upgrades every decision.
Written by Nour Boustani for mid-five to low-six-figure founders and operators who want compounding improvements without wasting weeks fixing the wrong problems at the wrong depth.
Recurring fires at $40K–$90K/month signal shallow diagnosis, not weak effort. Start premium access to the 5-Layer Strategic Analysis Framework and run root-cause analysis before your next major move.
› Library Navigation: Quick Navigation · Strategy Database
Diagnose Recurring Revenue And Team Fires With 5-Layer Strategic Analysis
Revenue stuck at $45,000 for 12 weeks, a key hire quitting, and burnout at $80,000 aren’t standalone problems; they’re different symptoms generated by the same underlying business structures.
What strategic analysis does
Strategic analysis examines problems across five layers: surface symptom, immediate cause, root cause, leverage points, and consequences.
That structure:
Pulls the real issues into view
Points at the single move that does the most work
Surfaces what that move will trigger next
Most operators stop at layer one or two; strategic operators drill through all five before they intervene.
Why problems aren’t what they appear
Most business problems aren’t what they appear to be.
Revenue stuck at $45,000 for 12 weeks isn’t a lead generation problem
Team member quitting isn’t a compensation problem
Burnout at $80,000 isn’t a capacity problem
These are symptoms of structures you built months ago that now quietly generate multiple issues you keep addressing one by one.
Cost of shallow analysis
Here’s what shallow analysis costs when you follow it: one operator spent $7,000 and 40 hours building a lead generation system while the real problem was a broken sales process.
Lead volume increased 30%
Close rate dropped 40%
Net revenue impact: zero
The fix amplified the real problem instead of solving it.
The 5-layer depth shift
Strategic analysis goes five layers deep: symptom → immediate cause → root cause → leverage points → consequences.
Most operators stop at layer one. That’s why they solve the same problems monthly instead of once.
The math is blunt:
Shallow analysis means temporary fixes that demand constant maintenance (high time cost, no compounding)
Deep analysis means permanent solutions that upgrade multiple areas simultaneously (one-time effort, exponential compounding)
You’re pouring real effort into fixes that barely move the business.
The inflection point comes when you start matching problem depth to solution depth instead of throwing surface hacks at structural issues.
Why Surface-Level Business Analysis Keeps You Stuck At $40K–$90K Month
Analysis often fails not because the problems are wrong, but because the depth is.
Most operators conflate symptom with cause.
What looks like the problem:
Revenue flat at $X for Y weeks
Instinct: “Leads must be low.”
What’s actually true:
Low leads are just one possible cause among many
Without systematic analysis, every “fix” is a guess
Result:
You guess at causes
You implement solutions that don’t match the real problem
The same issues keep regenerating
The Bottleneck Audit teaches this principle for business constraints. Strategic analysis takes it five layers deeper.What changes with systematic analysis
Here’s what changes when you analyze systematically instead of reactively.
Before systematic analysis
Business shows 8 visible problems
Operator tries to fix all 8 individually
Progress minimal
Exhaustion maximal
After systematic analysis
Business still shows 8 visible problems
All 8 trace back to 2 root issues
Fix those 2 root issues and all 8 problems disappear automatically
Progress maximal
Energy preserved
How the math compounds
Fixing symptoms means solving the same problems repeatedly (low leverage, high time cost).
Fixing root causes means solving multiple problems once (high leverage, sustainable results).
Pattern: “Capacity” that isn’t capacity
One more pattern worth noting: operators at $80,000 monthly, working 65 hours weekly, diagnosing “not enough capacity.”
Real issue: No delegation system — the founder is doing all the deliveries despite a team of 5.
Surface solution: Hire more people (would’ve made the problem worse).
Deep analysis: Revealed a structural fix (systematic delegation) that freed 30 hours weekly without adding headcount.
The Quality Transfer provides the delegation protocol. Strategic analysis reveals when delegation is the answer versus when something else is the bottleneck.
Why shallow analysis feels like “hard work, no movement”
You’ve probably experienced this: you work incredibly hard on a solution and nothing moves, because the analysis stayed shallow and all that effort went into the wrong problem, so the net result is effectively zero.
Here’s the framework that prevents that.
The 5-Layer Strategic Analysis Framework For Stuck $40K–$90K Month Operators
Strategic analysis isn’t one question – it’s five sequential questions that take you from surface symptom to strategic intervention.
The Framework Structure:
LAYER 1: SURFACE SYMPTOM
    |
    v  (What directly caused this?)
LAYER 2: IMMEDIATE CAUSE
    |
    v  (What system enables this?)
LAYER 3: ROOT CAUSE
    |
    v  (Where's maximum leverage?)
LAYER 4: LEVERAGE POINTS
    |
    v  (What breaks next?)
LAYER 5: CONSEQUENCES
The Framework Structure
Layer 1 – Surface Symptom: What appears to be broken?
Layer 2 – Immediate Cause: What directly created this symptom?
Layer 3 – Root Cause: What system dysfunction enables this cause?
Layer 4 – Leverage Points: Where can intervention create maximum impact?
Layer 5 – Consequences: What new problems will this solution create?
Most operators stop at Layer 1 (symptom) or Layer 2 (immediate cause). Strategic operators go through all five layers before choosing an intervention.
Here’s what each layer reveals and why it matters.
Layer 1 - Surface Symptom (What Appears Broken)
The question: What’s the observable problem?
What you’re identifying: The presenting issue that made you notice something’s wrong.
Common symptoms:
Revenue flat or declining
Client churn accelerating
Team member quit unexpectedly
Founder burnout despite strong revenue
Margin compressing while revenue grows
Can’t scale past specific revenue threshold
A symptom only tells you that something is wrong, but it doesn’t tell you what is wrong or why it is happening.
Layer 1 protocol:
Write a clear problem statement. Make it specific and quantifiable.
Weak symptom statement:
“Revenue isn’t good.”
Strong symptom statement:
“Revenue flat at $42,000 monthly for 8 consecutive weeks after growing 15% monthly for previous 6 months.”
Specificity matters because vague problem statements lead to vague solutions.
“Revenue isn’t good” could mean anything. “Revenue flat at $42,000 for 8 weeks” gives you concrete data to analyze.
Time investment: 30 minutes to define the symptom clearly and quantify the impact.
Layer 2 - Immediate Cause (What Directly Created the Symptom)
The question: What directly caused this symptom to appear?
What you’re identifying: The one-level-deeper cause that’s creating the observable symptom.
Critical distinction: The immediate cause created the symptom. But something created the immediate cause. Don’t stop here.
Layer 2 protocol
Use 5 Whys methodology. Ask “why?” repeatedly until you get past surface explanations.
Example sequence — Symptom: Revenue flat at $42,000 for 8 weeks
Why? Not closing new clients
Why? The pipeline exists, but the conversion rate dropped from 35% to 18%
Why? Proposals are getting more rejections than normal
Why? No repeatable proposal template - every pitch customized, quality inconsistent
Why? Never built a standardized sales system
That fifth “why” starts approaching the root cause. Most operators stop at the second or third why and implement solutions there.
Common immediate causes
Pricing too low (but why is pricing too low?)
Poor client fit (but why are you attracting poor fits?)
Team overworked (but why is the workload unmanageable?)
Founder bottleneck (but why can’t the team decide without the founder?)
Time investment: 1 hour to identify and validate immediate causes with data, not assumptions.
Layer 3 - Root Cause (System-Level Issue)
The question: What system dysfunction enables this immediate cause?
What you’re identifying: The structural problem creating multiple symptoms across your business.
The critical distinction is that the root cause is systemic, so when you fix it, multiple immediate causes and their symptoms disappear at once instead of needing separate fixes.
Layer 3 protocol
- Map system dynamics so you can see how parts of the business interact.
- Identify what connects to what across functions and workflows.
- Look for structural issues in:
Policies
Systems
Incentives
Capacity
Visual mapping helps here — tools like Miro (free tier available) or Excalidraw (completely free) let you see connections you’d miss in text.
How to sketch it:
Draw boxes for each component: pricing, delivery, team, sales.
Add arrows showing how each component influences the others.
Circle or group the clusters that interact heavily so structural patterns are obvious at a glance.
+---+         +---+
| P |         | S |
+---+         +---+
  |             ^
  v             |
.------------------.
|+---+  <-->  +---+|
|| T |        | D ||
|+---+        +---+|
'------------------'

P = pricing
S = sales
T = team
D = delivery
How to identify root cause
Test hypothesis:
“If I fix this root cause, do multiple symptoms disappear?”
Example:
Root cause candidate: No pricing strategy
Test: If we fix the pricing strategy, does it solve the problems of low revenue, poor client quality, and founder overwork?
Answer: Partially — solves revenue and client quality, doesn’t solve founder overwork
Conclusion: Pricing is a cause, but not the root cause
Actual root cause: No delegation system
Test: If we fix delegation, does it solve: founder overwork, team underutilized, decision bottlenecks, scaling limitation?
Answer: Yes to all four
Conclusion: Delegation dysfunction is the root cause
Common root causes:
No repeatable systems (everything custom, nothing scales)
No qualification criteria (accepting wrong clients)
No delegation protocols (founder bottleneck in every decision)
Misaligned business model (service model doesn’t scale with current pricing)
No strategic positioning (competing on price instead of value)
Root causes are structural. They’re built into how your business operates, so fixing symptoms or immediate causes leaves the structure intact — problems regenerate.
Time investment: 2 hours to map system dynamics, identify structural issues, and test your root cause hypothesis.
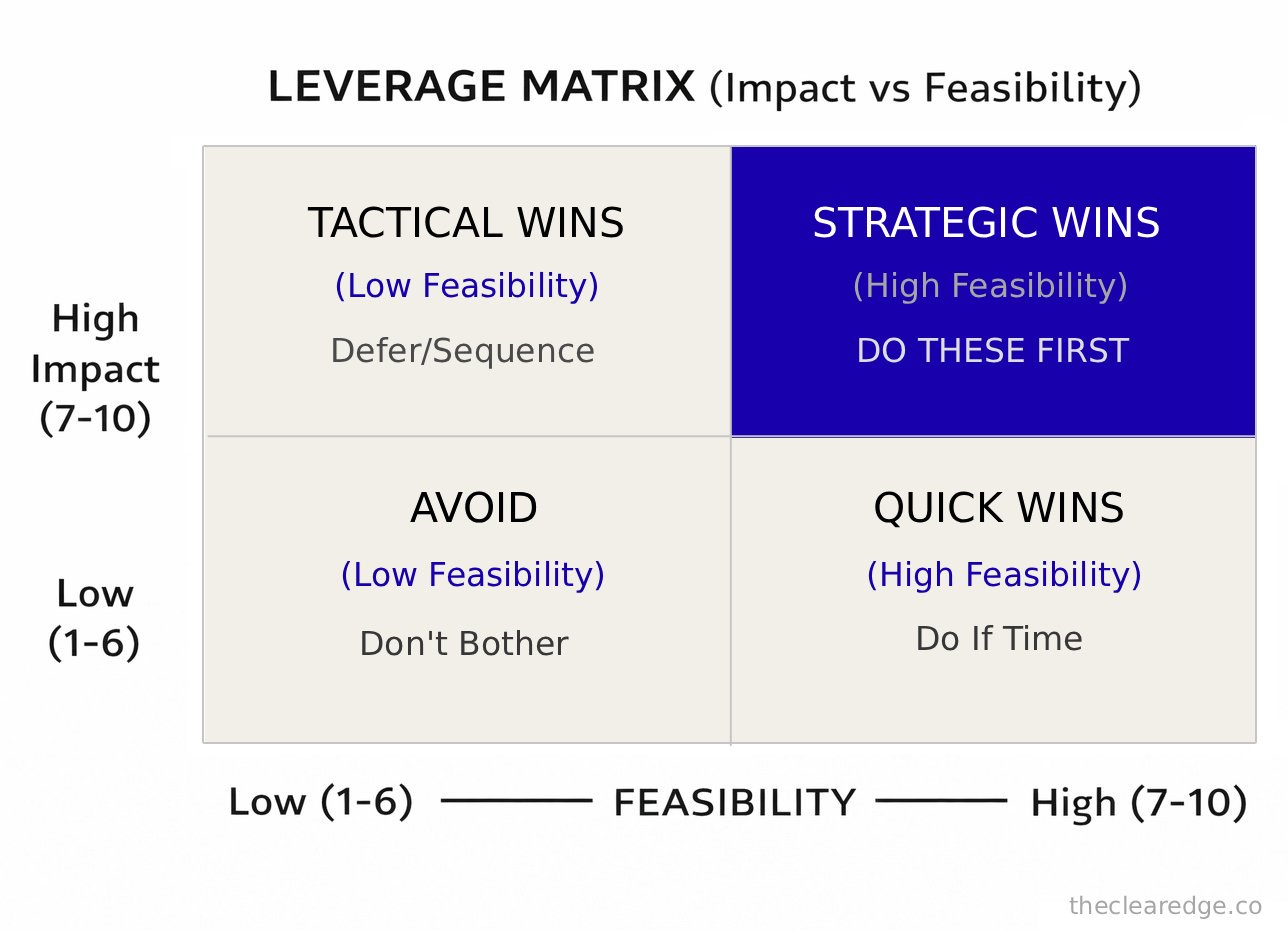
Layer 4 - Leverage Points (Where Intervention Creates Maximum Impact)
The question: Where can I intervene for maximum impact with minimum effort?
What you’re identifying: The specific intervention points where small changes create disproportionate results.
Critical distinction: Not all root causes are equal; some create 10x more impact than others, and leverage points are where you find the highest-return interventions.
Layer 4 protocol
List all possible interventions.
Score each on impact (1–10) and feasibility (1–10).
Choose the option with the highest leverage.
Scoring framework
Impact score (1–10):
10 – Solves the problem completely, enables multiple improvements
7 – Solves 70–80% of the problem
5 – Solves 50% of the problem
3 – Partial solution, limited scope
1 – Minimal impact
Feasibility score (1–10):
10 – Can implement today with existing resources
7 – Can implement this week with minor resource allocation
5 – Can implement this month with moderate effort
3 – Requires significant new capability or resources
1 – Nearly impossible with current constraints
Leverage calculation: Impact × Feasibility = Priority Score
Example leverage analysis:
Problem: Revenue stuck at $95,000 monthly for 6 months
Root cause: Founder bottleneck - team waiting on the founder's decisions for everything
Intervention options:
Highest leverage: Document top 10 recurring decisions (score 72) – implement this week, frees 15 hours monthly immediately, and creates the foundation for a fuller protocol later.
Why this is strategic thinking:
You’re not just identifying what to fix, you’re choosing the optimal intervention sequence based on:
Impact: How much this single move improves throughput and decision speed.
Feasibility: How fast and cheaply you can implement it with current resources.
Leverage: How much future work it removes by turning ad-hoc decisions into repeatable rules.
Focus That Pays demonstrates this kind of leverage thinking for protecting time – protecting 20 hours that generate 80% of results.
Time investment — Spend 1 hour to:
List all plausible interventions.
Score each systematically on impact and feasibility.
Identify and commit to the single highest leverage option.
Layer 5 - Consequences (Second and Third-Order Effects)
The question: What new problems will my solution create?
What you’re identifying: Unintended consequences, second-order effects, and cascading impacts of your intervention.
Critical distinction: Every solution creates new problems, so strategic operators design for consequences while reactive operators get surprised by them.
Layer 5 protocol
For the chosen intervention, map what breaks if you implement it.
Framework for consequence mapping:
First-order effects: Direct results of your intervention (usually positive).
Second-order effects: What those direct results enable or prevent (mixed).
Third-order effects: What happens 6–12 months downstream (often surprising).
Example: Consequence Analysis
Intervention: Build a standard proposal template to increase the close rate.
First-order effects (intended):
Close rate increases from 25% to 40%.
Proposal creation time drops from 8 hours to 2 hours per proposal.
Revenue unsticks, grows from $45,000 to $58,000 monthly.
Second-order effects (predictable):
Some prospects want bespoke solutions – template doesn’t fit.
Lose 10–15% of potential clients who need customization.
Sales team needs a different skill set (template execution vs custom consulting).
Third-order effects (strategic implications):
Business bifurcates into two tiers: standard (template) and premium (custom).
Standard tier becomes scalable, premium tier remains founder-led.
Revenue model shifts from all-custom to 70% productized / 30% bespoke.
Enables hiring a junior delivery team for the standard tier.
Design for consequences
Don’t try to prevent all negative consequences. Design around them.
For this example:
Accept 10–15% client loss as the cost of scalability.
Build two-tier pricing immediately: standard template at $X and custom at 2× $X.
Use the premium tier for clients requiring customization.
Scale standard tier with team, keep premium tier exclusive.
This is strategic thinking: anticipating what your solution breaks and designing for it proactively rather than fixing it reactively.
Common consequences to map:
What does this make impossible? (tradeoffs)
What new capability does this require? (skill gaps)
What does this commit us to? (long-term obligations)
What optionality does this eliminate? (closed doors)
What new problems does this create? (emergent issues)
Time investment: 1 hour to map consequences, design mitigation strategies, and build a two-tier approach when needed.
Protect Yourself From Repeat Problems
If you recognize your own patterns in the $7,000 misfire and the $23,000 recovery, using the full practice protocol inside premium keeps you from paying that same learning tax twice.
Strategic Analysis Framework In Practice For Five Common Business Problems
Here’s the complete framework applied to five common business problems. Notice how each layer reveals information that the previous layer missed.
Analysis 1 – Revenue Stuck At $45,000 For 3 Months
Layer 1 – Surface Symptom
Revenue has been flat at $45,000 per month for 12 consecutive weeks, after previously growing 12–15% per month for 6 months before growth stopped completely.
There’s no obvious external cause:
Market conditions have not changed.
Competitive landscape remains the same.
The offer itself is unchanged.
First instinct:
“Need more leads.”
That’s where most operators stop.
Layer 2 – Immediate Cause
Not closing new clients despite a healthy pipeline.
There are currently 22 active prospects per month, up from 18 during the earlier growth phase.
The sales conversion rate has dropped from 32% to 14%.
At the current conversion rate, the business now closes about 3 clients per month instead of the previous 6.
Revenue is flat because the business is closing half as many deals despite having more prospects. Most operators would try to fix this by hiring a salesperson, running ads, and building a new funnel. All wrong.
Layer 3 – Root Cause
No repeatable sales system.
Every proposal is currently custom-built from scratch.
Proposal quality swings up or down depending on how much time is available.
When growth was slower and you had 8–10 hours per proposal, the close rate stayed strong.
At the current volume, with only 3–4 hours per proposal, quality drops, prospects sense inconsistency, and the close rate collapses.
The tell: the conversion rate dropped exactly when prospect volume increased. Not because prospects got worse, but because proposal quality got worse under time pressure.
Structure creating the problem: a custom proposal requirement combined with increased volume causes a quality collapse.
If you fix volume by reducing prospects, revenue drops
If you fix quality by spending more time, you can’t scale
Fix the system, and both problems disappear.
Layer 4 - Leverage Points:
Generated 6 solution options:
Hire a salesperson to handle proposals
Impact: 7
Feasibility: 4
Score: 28
Expensive, slow to onboard, and doesn’t fix the underlying system.
Build a standard proposal template
Impact: 9
Feasibility: 9
Score: 81
Can be implemented in 1 week and improves consistency immediately.
Reduce prospect volume by 50% to improve quality
Impact: 6
Feasibility: 8
Score: 48
Improves quality but artificially caps growth.
Raise prices to reduce volume naturally
Impact: 5
Feasibility: 7
Score: 35
Helps with volume but doesn’t fix the root cause.
Build a proposal library of common sections
Impact: 8
Feasibility: 8
Score: 64
Strong option, but a full template is still better.
Outsource proposal writing
Impact: 6
Feasibility: 5
Score: 30
Creates a quality control risk and complexity.
Highest leverage (score 81)
A standard proposal template that:
Can be built this week.
Frees 6 hours weekly currently spent on custom proposals.
Improves consistency dramatically.
Implementation plan:
Document the last 10 successful proposals.
Identify the common structure.
Build a template with modular sections for customization (about 80% standard and 20% custom per prospect).
Time investment and payoff:
Time to build: 8 hours.
Time saved weekly: 6 hours.
ROI: Breaks even in about 10 days, then becomes permanent time savings.
Layer 5 – Consequences
Positive (first-order):
Close rate recovers to 35–40% because the template ensures consistency.
Proposal time drops by 75%, from 3–4 hours to about 45 minutes per proposal.
Revenue grows to $58,000–$62,000 monthly within 8 weeks.
Capacity increases so the business can handle 30+ prospects monthly without a quality drop.
Negative (second-order):
The template doesn’t fit all prospects perfectly.
The business loses 10–15% of prospects who need heavy customization.
The sales process feels less “boutique”.
Some prospects comment on the level of standardization.
Design for Consequences
Don’t try to prevent template rejection. Instead, build a two-tier system:
Standard tier: Template-based proposal at $4,500, designed so 80% of prospects fit here; this becomes a scalable foundation.
Premium tier: Custom proposal at $9,500 for the remaining 20% of prospects who need heavy customization; this tier is founder-led and stays boutique.
This turns a negative consequence (the template doesn’t fit everyone) into a business model advantage through clear tier separation and premium pricing for custom work.
Implementation sequence
Week 1: Build the template and test it on 3 new prospects.
Week 2: Adjust based on feedback and define what triggers the premium tier.
Weeks 3–4: Apply the system consistently and track close rates by tier.
Weeks 5–8: Optimize the template based on data and scale the standard tier.
Actual result timeline
Week 4: Close rate improves from 14% to 28% (early signal).
Week 8: Close rate stabilizes at 38%, which is better than the pre-problem level.
Week 8: Revenue increases from $45,000 to $61,000 (net growth).
Week 12: Revenue climbs from $61,000 to $68,000 as the template enables higher volume.
Strategic Payoff
Strategic analysis prevented:
Hiring an expensive salesperson (about $3,000+ monthly).
Wasting time and money on the wrong solution, such as ad spend on a broken sales process.
Imposing artificial growth caps by reducing volume instead of fixing structure.
Time investment and payoff
Time invested in 5-layer analysis: 5 hours.
Time saved from wrong solutions: more than 40 hours.
Revenue unlocked: $23,000 monthly increase.
Analysis 2 – Key Team Member Quit Unexpectedly
Layer 1 – Surface Symptom
Your top performer, who was handling 40% of client delivery, resigned with just 2 weeks’ notice, citing “feeling undervalued and overworked” in the exit interview.
Layer 2 – Immediate Cause
Team member felt underappreciated:
No recognition system.
Unclear performance expectations.
Workload doubled over 6 months while others stayed at the same level.
No compensation adjustment despite increased responsibility.
Layer 3 – Root Cause
No team calibration system:
No regular 1-on-1s.
No workload balancing protocol.
No clear career progression.
No structured feedback mechanism.
The founder assumed “no news is good news,” while the team member burned out quietly.
Layer 4 – Leverage Points
Options evaluated:
Hire replacement immediately (Impact: 5, Feasibility: 6, Score: 30)
Implement weekly 1-on-1s with all team (Impact: 9, Feasibility: 8, Score: 72)
Build workload balancing system (Impact: 8, Feasibility: 7, Score: 56)
Create career progression framework (Impact: 7, Feasibility: 5, Score: 35)
Highest leverage: Weekly 1-on-1s
Prevents about 80% of preventable turnover.
Takes around 3 hours weekly.
Catches issues early before they compound into resignations or crises.
Layer 5 – Consequences
Positive:
Team retention improves dramatically.
Issues surface early when they’re still fixable.
Team feels valued and heard.
Expensive turnover is prevented.
Negative:
Requires 3 hours weekly of founder time for 1-on-1s.
Surfaces problems that need solving (can’t be ignored anymore).
Design For Consequences:
Accept a 3-hour weekly commitment as insurance against $30,000–$50,000 turnover costs. Surface problems early when they’re cheap to fix, instead of late when they’re expensive.
Result:
Implement the 1-on-1 system.
Add workload balancing in month 2.
Team stability improves.
The next resignation is prevented before it happens.
Analysis 3 – Feeling Burned Out Despite $80,000 Monthly Revenue
Layer 1 – Surface Symptom
The founder is exhausted, dreading work, and their health is declining despite strong revenue. They are working 65 hours weekly with no recovery time and seeing declining performance in all areas.
Layer 2 – Immediate Cause
Working 65 hours weekly with zero recovery time:
Every hour is packed with work.
There is no margin and no buffer.
The founder stays in a constant stress state.
Layer 3 – Root Cause
No delegation system.
The founder is personally doing all client delivery work, even though there is already a team of 5 in place.
The team’s role is limited to admin and coordination, while the founder handles all revenue-generating work alone.
The current structure was created when the founder was solo and was never upgraded to a team-based delivery model as the business grew.
The team is willing and capable of taking on more, but the founder never created clear delegation protocols to transfer the work.
Layer 4 – Leverage Points
Options evaluated:
Reduce client load by 40% (Impact: 6, Feasibility: 9, Score: 54)
Build systematic delegation over 8 weeks (Impact: 10, Feasibility: 7, Score: 70)
Hire additional team for capacity (Impact: 7, Feasibility: 6, Score: 42)
Take a 2-week break to recover (Impact: 4, Feasibility: 8, Score: 32)
Highest leverage: Systematic delegation – frees 30 hours weekly permanently, grows team capability, and enables sustainable scale.
Layer 5 – Consequences
Positive:
Hours drop from 65 to 35 weekly.
Energy is restored and health improves.
The team becomes more capable.
The business becomes more valuable.
Negative:
Less control over client delivery initially
A quality dip is possible during the transition
The founder faces an identity crisis (no longer “doing the work”)
Design for Consequences:
Run an 8-week delegation transition using quality transfer protocols
Accept temporary control loss for permanent sustainability gain
Reframe founder identity from “deliverer” to “architect.”
Result:
Complete the delegation transition over 8 weeks.
Hours drop from 65 to 40 by week 6.
Energy is restored.
The team handles delivery at 90% quality level by week 8.
A sustainable model is achieved.
Analysis 4 – Can’t Scale Past $100,000 Monthly Revenue
Layer 1 – Surface Symptom
Revenue oscillates between $95,000 and $105,000 for 6 months. The business can hit $105,000, but can’t maintain it – it always drops back to the $95,000–$100,000 range.
Layer 2 – Immediate Cause
Founder bottleneck in decision-making.
A team of 8 is waiting on the founder’s approval for everything, including client changes, process adjustments, resource allocation, and hiring decisions.
The founder is working 60 hours per week just to process these decisions.
With all available time consumed by approvals, there is no space left for strategic work.
Layer 3 – Root Cause
The founder is stuck in tactical execution instead of doing CEO-level work.
The business was originally built around the founder as an expert practitioner, and the founder is still operating like a senior operator instead of a business architect.
As a result, every decision continues to flow through the founder simply because that’s how the business has always worked.
Layer 4 – Leverage Points
Options evaluated:
Hire VP Operations to handle decisions (Impact: 8, Feasibility: 5, Score: 40)
Document top 20 recurring decisions (Impact: 7, Feasibility: 9, Score: 63)
Run a 12-week founder transition to a CEO role (Impact: 10, Feasibility: 6, Score: 60)
Build a 3-tier decision framework (Impact: 9, Feasibility: 7, Score: 63)
Highest leverage (tie):
Document decisions.
Build decision framework
Both score 63 and are implemented sequentially over 4 weeks.
Layer 5 – Consequences
Positive:
Operational independence is achieved.
Founder is freed for strategic work.
Team is empowered to decide without a bottleneck.
Scale is unlocked to about $150,000–$200,000 monthly.
Negative:
Founder role completely changes (identity crisis is common).
Some decisions are made sub-optimally at first.
Requires trusting the team with key business outcomes.
Design for Consequences:
Accept role transition as a necessary evolution.
Build a decision framework with clear authority levels.
Accept that 10–15% of decisions will be sub-optimal initially as the cost of scale.
Result:
12-week transition completed.
Tactical decisions are delegated.
Founder focuses on strategy and key relationships.
Revenue grows from $100,000 to $142,000 over 4 months post-transition.
Analysis 5 – Margin Compressing While Revenue Grows
Layer 1 – Surface Symptom
Margin dropped from 45% to 28% over 6 months while revenue grew from $78,000 to $94,000 monthly, so revenue is increasing but profit is shrinking.
Layer 2 – Immediate Cause
Costs are rising faster than revenue:
The team grew from 3 to 7 people over 6 months.
Delivery costs increased by $18,000 monthly.
Revenue increased by only $16,000 monthly in the same period.
Layer 3 – Root Cause
The service model doesn’t scale.
The current delivery model only scales through linear team growth.
Every additional $10,000 in revenue requires roughly $7,000 in extra delivery costs.
The business operates as a custom service that scales linearly instead of as a leveraged model that can grow without matching headcount and cost increases.
Layer 4 – Leverage Points
Options evaluated:
Raise prices 40% (Impact: 8, Feasibility: 7, Score: 56)
Reduce team size (Impact: 6, Feasibility: 5, Score: 30)
Productize services (Impact: 10, Feasibility: 6, Score: 60)
Automate delivery processes (Impact: 7, Feasibility: 6, Score: 42)
Highest leverage: Productize services – transition from custom to standardized delivery over 12 weeks, enabling leverage without more headcount.
Layer 5 – Consequences
Positive:
Margin recovers to about 48%.
The service becomes scalable.
Revenue can grow without proportional team growth.
The business model fundamentally improves.
Negative:
Less customization available.
Some clients won’t fit the new model (about 10–15% churn expected).
Team needs retraining for productized delivery.
Design for Consequences:
Build a two-tier model:
Core productized service (standard, scalable).
Premium custom tier (high-touch, boutique).
Transition about 70% of clients to the productized tier.
Keep about 30% in the premium tier at about 2× pricing.
Result:
12-week transition complete.
Margin improves from 28% to 48%.
Churn lands at about 12%, as expected.
Revenue holds around $92,000 (slight dip during transition), but the business is now scalable to about $150,000 without margin compression.
When 5-Layer Strategic Analysis Fails And What To Use Instead
This framework isn’t universal. It’s designed for structural, controllable business problems, not for emergencies or trivial issues. Here’s when it fails and what to use instead.
Failure Mode 1: Crisis situations requiring immediate action
If the business is literally on fire (payroll due tomorrow with no cash, key client threatening lawsuit, website down during launch), don’t run a 5-layer analysis. Act first, analyze later.
What to do instead:
Handle the crisis with an immediate tactical response.
Stabilize the situation and restore basic operations.
After the crisis is resolved, run a 5-layer analysis to prevent recurrence.
Failure Mode 2: Problems requiring less than 30 minutes to fix
If the solution is obvious and fast (typo on sales page, broken email link, simple process tweak), just fix it. Don’t over-analyze.
What to do instead:
Fix the issue immediately.
Document it on a “quick wins” list.
If the same issue recurs 3 or more times, then run a 5-layer analysis to find the root cause.
Failure Mode 3: External problems you can’t control
If the problem is a market crash, regulatory change, or platform algorithm shift, a 5-layer analysis mostly reveals causes you can’t fix.
What to do instead:
Use Layers 1–3 to identify what’s broken and why.
Skip Layer 4 (leverage points inside systems you control).
Jump straight to: “Given this external reality, what’s our optimal adaptation strategy?”
Failure Mode 4: Analysis paralysis – spending weeks analyzing instead of implementing
If you’ve spent 10+ hours on analysis and still can’t decide, you’re overthinking.
What to do instead:
Set a 6-hour analysis time limit upfront.
After 6 hours, choose the highest-scoring intervention even if you are uncertain.
Implement a small test, measure results, and iterate from data.
Default to action over perfect analysis.
The pattern: Strategic analysis works for structural business problems you control. It fails for crises, trivial issues, external forces, and when you use it to avoid deciding.
Building Strategic Analysis Capability With A 5-Layer Practice Protocol
Strategic analysis is a skill, not a talent, and you develop it through deliberate practice over time; here’s the proven progression for taking this capability from beginner to expert level.
Week 1–2: Shallow Problems (Foundation Building)
Goal: Learn the framework on simple problems where analysis is fast.
Practice protocol:
Pick simple business problems (client complaint, pricing question, minor process issue).
Run all 5 layers on each problem.
Time yourself – aim for 30–45 minutes per analysis.
Focus on completing the framework, not finding perfect answers.
Document in Notion (free for personal use) or Google Docs using this template
Analysis Template Structure:
- PROBLEM: [One sentence]
- DATE: [When analyzing]

---

LAYER 1 - SYMPTOM:
What's observable? Quantify if possible.

---

LAYER 2 - IMMEDIATE CAUSE:
What directly caused symptom? (Run 5 Whys here)

---

LAYER 3 - ROOT CAUSE:
What system dysfunction enables this?
Test: If I fix this, do multiple symptoms disappear?

---

LAYER 4 - LEVERAGE POINTS:
OPTION 1
Impact (1–10): X
Feasibility (1–10): Y
Score (X×Y): X×Y

---

OPTION 2
Impact (1–10): X
Feasibility (1–10): Y
Score (X×Y): X×Y

---

Highest score = do this first

---

LAYER 5 - CONSEQUENCES:
- Positive effects:___________
- Negative effects:___________
- Design for negatives:___________

---

IMPLEMENTATION:
- Next action:___________
- Timeline:__________
- Success metric:___________
Copy this template and fill it out for each analysis. After you complete 5–10 analyses, you’ll internalize the structure and won’t need a template anymore.
Example problems to practice:
Why did the last 3 sales calls not convert?
Why does the team keep asking the same questions?
Why is the weekly planning meeting always running over?
Why do certain clients always need extra support?
Success metric: Can complete a 5-layer analysis in under 1 hour, identifying clear symptoms through consequences.
Common mistakes in this phase:
Stopping at Layer 2 (immediate cause) – force yourself to complete all 5 layers.
Getting stuck finding a “perfect” root cause – pick the most likely candidate and test it.
Skipping consequences (Layer 5) – this becomes critical in complex problems.
Week 3–4: Medium Problems (Depth Building)
Goal: Apply the framework to actual business problems with stakes.
Practice protocol:
Pick current business problems (revenue flat, team issue, delivery problem).
Invest full time per layer (about 5–6 hours total analysis).
Don’t skip layers – thoroughness matters more than speed.
Validate findings with data, not assumptions.
Example problems to practice:
Why is revenue stuck at the current level?
Why is a specific client segment unprofitable?
Why does delivery consistently run over time?
Why can’t we scale past the current team size?
Success metric: Analysis reveals a non-obvious root cause that explains multiple symptoms. Solution addresses structure, not just symptom.
Common mistakes in this phase:
Rushing to a solution before completing analysis – resist the urge to “fix it now.”
Accepting the first root cause found – test the hypothesis and verify it explains multiple symptoms.
Ignoring feasibility in leverage analysis – a high-impact but impossible solution isn’t strategic.
Week 5–8: Complex Problems (Strategic Depth)
Goal: Develop strategic thinking on business-critical problems.
Practice protocol:
Pick strategic problems (business model, market positioning, growth ceiling).
Spend 6–8 hours on a complete analysis.
Map all connections and test multiple hypotheses.
Design for consequences proactively.
Example problems to practice:
Why can’t a business scale past $100,000 monthly?
Why is the margin compressing as revenue grows?
Why does a business model require unsustainable founder hours?
Why do strategic initiatives consistently fail to launch?
Success metric: Analysis reveals systemic issues, and the solution directly addresses structure. Consequences are mapped and designed for, and the implementation plan accounts for second and third-order effects.
Common mistakes in this phase:
Analysis paralysis – spending weeks analyzing instead of implementing.
Perfectionism in consequence mapping – you can’t predict everything.
Skipping small leverage wins while waiting for a perfect strategic solution.
Ongoing: Real-Time Application (Mastery Building)
Goal: Strategic analysis becomes an automatic thinking pattern.
Practice protocol:
Treat every business problem as a trigger for a 5-layer analysis.
Track: Did deep analysis lead to a better solution than surface analysis would have?
Refine: Notice patterns in your root causes – these reveal underlying business model issues.
Build a database using Airtable (free tier works fine) or Google Sheets with these columns:
Pattern Tracking Database Structure:
After 20–30 entries, filter by “Pattern Category” to see which root causes recur.
If “Sales/Systems” appears 8 times, your business has systematic sales structure problems that require fundamental redesign, not tactical fixes.
This database becomes your business’s diagnostic history. When a new problem appears, search the database for similar symptoms – often you’ve already solved the root cause and just need to apply the same solution.
Teach:
Explain the framework to your team.
Build a shared strategic thinking capability, not just a founder-only skill.
Success metric: The team starts using the framework without prompting, and strategic thinking becomes an organizational capability, not just a founder’s skill.
Mastery indicators:
Can identify a root cause in 30 minutes that would have taken 6 hours in Week 1.
Consequences mapping happens automatically – you see second-order effects without trying.
Solutions frequently address multiple problems with a single intervention.
Business problems decrease over time because you’re fixing structures, not symptoms.
Patterns You’ll See After 50+ Strategic Analyses
Once you’ve analyzed 50+ problems systematically, patterns emerge that make future analysis roughly 10x faster because you’ve already seen most of the underlying structures before.
Pattern 1 – “Revenue problems”
Most “revenue problems” (about 60–70%) trace back to pricing or positioning, not to lead generation volume or offer quality. Stop building new funnels and start fixing how you communicate value.
Pattern 2 – “Team problems”
Around 80% of “team problems” trace to unclear expectations or a founder bottleneck, not to having the wrong people or bad compensation. Stop reflexively hiring and start delegating systematically with clear ownership.
Pattern 3 – “Time problems”
About 90% of “time problems” trace to the absence of a prioritization system or clear boundaries, not to weak personal productivity or the wrong tools. Stop chasing productivity hacks and start eliminating work that doesn’t move core metrics.
Pattern 4 – “Client problems”
Most “client problems” (complaints, scope creep, payment issues) trace to poor qualification or unclear deliverables, not to “bad clients” or bad luck. Stop firefighting downstream and start qualifying harder and setting expectations more clearly upfront.
Pattern 5 – Margin compression
Margin compression almost always traces to a business model that doesn’t scale cleanly, usually a custom service model that requires proportional team growth for every revenue increase. Stop focusing on cost-cutting and start productizing so revenue can grow without margin collapse.
Track your analyses in a simple database with columns for Problem → Root Cause → Solution → Result so each new analysis adds to your pattern library.
After 20–30 entries, your recurring root causes become obvious and expose business model weaknesses that demand structural changes instead of more tactical fixes.
What Changes When You Think Strategically
Here’s what shifts when operators move from reactive problem-solving to strategic analysis:
1. Problems decrease instead of multiply
Reactive operators solve the same problems repeatedly – symptoms keep regenerating because the structure is unchanged.
Strategic operators solve problems once by fixing root causes – symptom generation stops.
One business had 12 recurring problems consuming 15 hours every week. After strategic analysis revealed 3 root causes:
They fixed those 3 root causes.
Fixing those 3 root causes stopped all 12 recurring problems.
Eliminating those 12 problems permanently reclaimed 15 hours every week.
2. Solutions compound instead of conflict
When you fix symptoms one by one, your solutions often conflict and solving problem A can make problem B worse.
When you fix root causes, your solutions compound and solving problem A improves problems B, C, and D automatically.
Decision quality improves exponentially
Strategic thinking stops bad decisions before they’re made by forcing you to test solutions against the wider system first.
Consequence mapping reveals what will break or change before you implement a solution.
Seeing those consequences upfront saves months of painful backtracking and cleanup work.
Business becomes systematically better
Reactive operators maintain the status quo by staying in constant firefighting mode.
Strategic operators improve the business structure by eliminating root causes instead of just solving surface problems.
As structural issues are removed, the business itself gets fundamentally better over time.
Founder hours drop while results improve
Strategic analysis reveals high-leverage interventions that require less effort for more impact.
Instead of working harder on symptoms, founders work smarter by changing underlying structures.
In one case, a founder reduced their workload from 60 hours to 35 hours per week over 12 weeks while revenue grew by 28%, because analysis exposed delegation as the root cause and systematic delegation freed 25 hours weekly and unlocked growth.
Team capability increases
Teaching a strategic analysis framework to the team distributes problem-solving capability across the organization.
Instead of the founder analyzing every problem alone, the team builds its own strategic thinking muscles.
As more people think this way, the company’s organizational intelligence compounds over time.
The Cost Of Surface-Level Business Problem Solving
Here’s what happens when analysis stays shallow:
1. You solve the wrong problems efficiently when your analysis is shallow.
Fast execution on bad analysis turns all that effort into wasted work.
Measuring “how busy” you are instead of “what improved” only tracks activity, not real progress.
Example:
One operator spent 40 hours over 6 weeks building a lead generation system, but the real problem was the conversion rate rather than lead volume, so the new leads only exposed the poor conversion faster and the net result was zero revenue impact and 40 hours wasted.
Strategic analysis would have:
Strategic analysis revealed conversion as the true bottleneck in about 2 hours.
With that clarity, they directed 15 hours of work into building a focused conversion system.
That single shift increased revenue by about $12,000 per month.
2. Problems regenerate faster than you fix them
Treating symptoms without fixing structure means the same problems return weekly. You get stuck in a maintenance loop instead of an improvement cycle.
3. Solutions create new problems you didn’t anticipate
Without consequence mapping, every fix you implement breaks something else in the system, and you end up playing whack-a-mole with interconnected parts of the business.
Example:
One business raised prices 40% without running a consequence analysis, lost 35% of clients instead of the expected 15–20%, failed to design a two-tier model to retain the price-sensitive segment, and ended up with an 18% revenue drop despite the higher prices.
4. Strategic opportunities stay invisible
Surface analysis reveals obvious problems.
Strategic analysis reveals non-obvious leverage points where small changes create disproportionate results.
5. Competitive advantage erodes
Competitors who use strategic analysis improve faster because they’re fixing underlying structures while you’re still fixing surface symptoms, and that performance gap widens more with every cycle.
The math
If you’re solving symptoms, you’re running to stay in place (zero net progress).
If you’re solving root causes, you’re compounding improvements (accelerating progress).
Every week you operate without strategic analysis costs you months of potential progress.
How To Integrate 5-Layer Strategic Analysis With Other Clear Edge Frameworks
Strategic analysis doesn’t exist in isolation. Here’s the tactical sequence for using it with other frameworks.
Sequence 1 – Finding What to Analyze
Use the Signal Grid first to filter signal from noise.
Not every problem deserves a 5-layer analysis – only high-impact problems that affect revenue or capacity. The Signal Grid identifies the 2–3 problems worth deep analysis this month.
Then: Run a 5-layer analysis on those 2–3 problems only. Ignore everything else.
Sequence 2 – Diagnosing Constraints
Run The Bottleneck Audit to identify your current growth constraint (offer, delivery, sales, or fulfillment bottleneck). Then use a 5-layer analysis to understand why that bottleneck exists structurally.
Example:
Bottleneck Audit says: “sales is bottleneck.”
Strategic analysis reveals: “no repeatable proposal system is the root cause creating the sales bottleneck.”
Think of it as:
Bottleneck Audit → what’s broken.
Strategic analysis → why it’s broken + how to fix it permanently.
Sequence 3 – Breaking Growth Ceilings
When hitting a revenue ceiling, use The Next Ceiling to map the constraint preventing breakthrough (for example, $50K ceiling, $100K ceiling). Then run Layer 3 (root cause) and Layer 4 (leverage points) specifically on that ceiling.
Most ceilings are not “need more tactics.” They are structural issues such as:
Founder bottleneck.
Business model doesn’t scale.
Wrong client profile.
Strategic analysis prevents wasting 6 months trying to break the ceiling with tactics when the structure needs changing.
Sequence 4 – Resource Allocation
Use Layer 4 (leverage points) to identify the highest-impact interventions. Then use Focus That Pays to protect the hours needed to implement those interventions.
Strategic analysis identifies what to work on.
The Focus framework protects the time to actually do it.
Sequence 5 – Implementation Direction
Three Moves to $50K provides direction, protection, and a multiplication framework. Use Layer 5 (consequences) to ensure your direction is right before you multiply effort.
Multiplication only works if the direction is correct: Strategic analysis validates direction by revealing what breaks if you’re wrong.
The pattern” Other frameworks identify problems or provide tactics, while strategic analysis reveals root causes and optimal interventions so you can use them together sequentially, not separately.
The Question that Reveals Your Thinking Depth
Here’s the diagnostic question: When you face a business problem, do you immediately jump to a solution, or do you systematically analyze the root cause first?
Most operators jump to a solution. That’s why they end up solving the same problems repeatedly.
Strategic operators pause, analyze deeply, choose a high-leverage intervention, and solve problems once.
The difference compounds exponentially over time.
Your 5-Layer Strategic Analysis Practice Starts Now
Strategic thinking isn’t theory — it’s practice. Here’s your implementation sequence.
Next 30 minutes
Pick one current business problem that’s been persistent (revenue stuck, team issue, delivery problem, margin pressure).
Write down the symptom specifically.
Not “revenue is bad” – write “revenue flat at $X for Y weeks.”
Run Layers 1–2 right now.
Identify the symptom and the immediate cause. Don’t solve yet – just analyze.
This week
Complete a full 5-layer analysis on that same problem, taking 4–6 hours in total and not rushing, because at this stage thoroughness matters more than speed.
By the end of the week, you should have:
A clear symptom.
A validated immediate cause.
A tested root cause hypothesis.
Scored leverage points.
Mapped consequences.
Before next month
Implement the highest-leverage intervention from your analysis.
Track: Did strategic analysis lead to a better solution than surface analysis would have?
Measure:
Time invested in analysis.
Time saved by solving root cause instead of symptoms.
Impact on the business.
Start the second analysis cycle on a different problem.
Strategic Analysis Milestones: What Good Looks Like
Timeline of Capability Shifts
Week 1
Complete the first 5-layer analysis in under 2 hours.
Identify the symptom, the immediate cause, and a root cause hypothesis.
Don’t expect perfection – focus on completing the framework.
Week 4
Can distinguish between symptom and cause automatically.
Stop jumping to solutions by default.
Analysis reveals non-obvious root causes about 60% of the time.
Month 3
Strategic analysis becomes a natural thinking pattern.
You see second-order consequences without effort.
The team starts adopting the framework without prompting.
Month 6
Business problems decrease 40–50% because you’re eliminating root causes instead of treating symptoms.
Solutions compound instead of conflict.
Decision quality measurably improves.
The Trade You’re Actually Making At $60K–$120K
If you won’t spend 4–6 focused hours mapping one problem through all layers, you’re accepting another quarter of flat $60K–$120K “effort with no lift.” Open your analysis doc and schedule the session today.
Run the 5-Layer Strategic Analysis Quick-Gate Checklist
Use this every time a persistent business problem shows up in your data or calendar and you’re about to jump straight to a solution.
☐ Wrote a specific, quantifiable Layer 1 symptom statement using the exact $ figure, time span, or capacity metric showing the persistence of this problem
☐ Scored all immediate causes in Layer 2 with real numbers from your pipeline, delivery, team, or margin data instead of narrative explanations
☐ Mapped one Layer 3 root cause that explains multiple symptoms and logged its pattern category in your strategic analysis database
☐ Calculated impact and feasibility scores for all Layer 4 leverage points and circled the single highest Priority Score as the next move
☐ Logged first, second, and third-order Layer 5 consequences for that chosen intervention, including what it breaks, what it commits you to, and what becomes impossible
Every time you run this, you avoid pouring weeks into the wrong fix and catch structural problems before they regenerate another cluster of $45K–$100K plateaus and team fires.
FAQ: 5-Layer Strategic Analysis Framework
Q: How does the 5-Layer Strategic Analysis Framework help founders stuck at $60K–$120K/month solve problems once instead of fighting the same fires weekly?
A: It takes every problem through five layers—Surface Symptom, Immediate Cause, Root Cause, Leverage Points, and Consequences—so you collapse 6–12 recurring issues into 2–3 structural problems, fix those once, and unlock jumps like $45K to $61K to $68K/month instead of repeatedly patching symptoms.
Q: How do I use the 5-Layer Strategic Analysis Framework with its five sequential questions before I commit to a solution?
A: You define a precise, quantified symptom, run 5 Whys to expose the immediate cause, map the system to find a root cause that explains multiple symptoms, score potential interventions on impact and feasibility to choose a leverage point, then map first-, second-, and third-order consequences before you execute so you don’t create new hidden problems.
Q: Why does surface-level analysis keep me stuck at plateaus like $45K or $80K even when I’m constantly “solving problems”?
A: Because you’re fixing symptoms (like “need more leads” or “need more capacity”) instead of the structural causes underneath, which leads to cycles like spending $7,000 and 40 hours on a lead gen system when the real issue is a broken sales process, or hiring more people when the real issue is zero delegation, so problems regenerate every few weeks.
Q: How do I know if what I’m calling a “problem” is actually just a surface symptom that needs deeper analysis?
A: When the statement is vague (“revenue isn’t good,” “team feels off,” “not enough capacity”) or keeps reappearing after short-term fixes, it’s a symptom; you rewrite it into a specific, measured description—like “revenue flat at $42,000 for 8 weeks after 6 months of 15% growth” or “founder working 65 hours weekly with a team of 5 doing only admin”—then push to deeper layers before acting.
Q: How do I identify and test a real root cause so I don’t stop too early at “leads,” “team,” or “capacity”?
A: You map out how systems interact (pricing, delivery, sales, team, model), propose a structural candidate like “no sales system,” “no delegation protocol,” or “misaligned business model,” and test it by asking if fixing it would resolve multiple symptoms—such as proposals, close rates, and revenue ceilings—rather than just one visible issue.
Q: How do I use the impact × feasibility scoring in Layer 4 to pick the best leverage point instead of a big but impractical solution?
A: You list all interventions (for example hiring a COO, building a decision protocol, documenting top 10 recurring decisions), score each 1–10 on impact and 1–10 on feasibility, multiply to get a priority score, and choose the highest scorer—like documenting the top 10 decisions with a 72 score that frees 15 hours monthly—over attractive but slow or expensive options that score lower.
Q: What happens if I skip Layer 5 and don’t map consequences before implementing a solution?
A: You risk classic second-order damage like raising prices 40% and losing 35% of clients because you didn’t design a two-tier model, productizing services and unintentionally churning premium clients, or standardizing proposals without planning a premium custom tier, which turns each “fix” into a new set of problems you then have to firefight.
Q: How do I practice the 5-Layer Strategic Analysis Framework so it becomes an automatic way of thinking, not a one-off exercise?
A: You start with 4–6 hours analyzing one meaningful problem, then run 30–60 minute analyses on new issues over 4–8 weeks, log each in a simple database with problem, root cause, solution, and 30-day result, and after 20–30 analyses you’ll see recurring pattern categories—like Sales/Systems, Team/Communication, and Model—that guide faster, deeper diagnoses.
Q: When should I not use the 5-Layer Strategic Analysis and what should I do instead in those situations?
A: You skip full analysis and act immediately when it’s a true crisis (payroll tomorrow, site down), a trivial fix (<30 minutes), or an external shock you can’t control; in those cases you handle the urgent issue first, then later run a lighter analysis to design prevention, or focus on adaptation strategy rather than trying to “fix” the external cause.
Q: What changes in my business over 4–12 weeks if I consistently analyze at five layers instead of reacting at one or two?
A: You start seeing multiple recurring problems trace back to a handful of structures—like pricing, delegations, or qualification—your interventions address those structures rather than scattered symptoms, founder hours drop from 60 to closer to 35–40 while revenue increases 20–30%, and problems stop regenerating because the systems that create them have been redesigned.
⚑ Found a Mistake or Broken Flow?
Use this form to flag issues in articles (math, logic, clarity) or problems with the site (broken links, downloads, access). This helps me keep everything accurate and usable. Report a problem →
› More to Explore: Quick Navigation · Strategy Database
➜ Help Another Founder, Earn a Free Month
If this system just saved you from spending 40+ hours and $7,000 fixing the wrong problem again, share it with one founder who needs that relief.
When you refer 2 people using your personal link, you’ll automatically get 1 free month of premium as a thank-you.
Get your personal referral link and see your progress here: Referrals
Get The 5-Layer Strategic Analysis Toolkit for Stuck $40K–$90K Operators
You’ve read the system. Now implement it.
Premium gives you:
Ready-to-use PDF toolkit—every template, diagnostic, and formula pre-filled, zero setup, immediate use
Plug-and-play AI diagnosis sessions—drop into Claude, Gemini or ChatGPT, answer a few questions, save hours of guessing, get your exact next move
Audio key points—concentrated frameworks you can absorb in minutes, implement while you move
Unrestricted access to the complete library—every system, every update
What this prevents: Wasting 4–6 hours and $7,000+ per cycle on shallow fixes that never touch the real root causes.
What this costs: $12/month. Covers the implementation toolkit for this 5-layer strategic analysis work and nothing else.
Download everything today. Implement this week. Cancel anytime, keep the downloads.
Already upgraded? Scroll down to download the PDF, audio, and your AI session.
