
The Quarterly Wealth Reset: Audit, Pivot, and Accelerate in 90 Days for $110K–$130K Operators
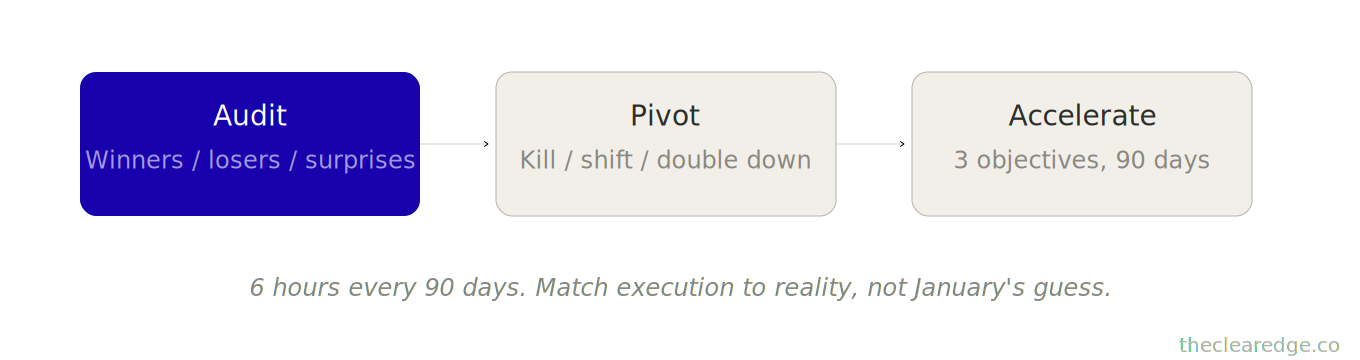
The Quarterly Wealth Reset inside The Clear Edge OS is a 6-hour, every-90-days system—Audit, Pivot, Accelerate—that classifies winners, losers, and surprises to realign $100K–$150K/month operators.


The Executive Summary
Founders at $100K–$150K/month risk drifting $180K–$420K a year by running on January plans; a 6-hour Quarterly Wealth Reset every 90 days audits, pivots, and accelerates execution so strategy tracks reality.
Who this is for: Founders and operators around $100K–$150K/month with full calendars and solid demand who can feel momentum slipping but can’t see exactly where the strategy broke.
The drift problem: Annual plans without quarterly resets turn mild misalignment into major loss—like the $126K/month coach who stayed locked on a capped group offer and missed $270K in one quarter.
What you’ll learn: The Quarterly Wealth Reset Framework—three moves (Audit, Pivot, Accelerate) plus a 6-hour ritual that classifies winners/losers/surprises, reallocates capacity, and sets 3 clear 90-day objectives.
What changes if you apply it: You kill losers like $18K webinar funnels, double down on winners that add $42K–$72K monthly, and turn flat $111K quarters into $134K runs while dropping founder hours from 52 → 34 weekly.
Time to implement: Expect 8–10 hours for your first reset, 6–7 hours for the second, then 5–6 hours every 90 days (about 24 hours yearly) that often prevents $180K–$420K in drift.
Written by Nour Boustani for $100K–$150K/month founders and operators who want strategy that compounds every 90 days without drifting on outdated plans, wasting quarters, or leaving $180K+ on the table each year.
$100K–$150K/month founders running on stale January plans use the Quarterly Wealth Reset and Weekly Time Fence inside The Clear Edge OS—upgrade to premium and enforce anti-drift protocols.
› Library Navigation: Quick Navigation · The Clear Edge OS
Why Annual Planning Creates Drift for $100K–$150K/Month Founders
This coaching business was holding $126K/month in revenue and a full set of locked-in annual goals.
For 6–8 months, she kept executing the same January plan, even after it stopped fitting the business by March. On paper, the numbers looked clean and the strategy looked solid.
In reality, $270K in drift was already priced into the year. Solid plan, clear targets, strong execution—and that’s the trap, because the plan still looks right while the money is already gone.
Quarter-by-quarter execution:
Q1 (Jan–Mar):
Built the group program curriculum for the new offer.
Launched the group program in March.
Reached 12 members paying $11,940 monthly.
Considered on track against the January plan.
Q2 (Apr–Jun):
Continued focusing on growing the group program.
Increased membership from 12 to 18, reaching $17,910 in monthly revenue.
Read as good progress on paper for the original annual targets.
Q3 (Jul–Sep):
Growth in the group program slowed noticeably.
Added only 2 members, going from 18 to 20 and reaching $19,900 in monthly revenue.
Still followed the January instruction to “get to 30 members by December” despite the slowdown.
October reality check:
Group program stalled at 20 members for 8 weeks.
Market signal was clear that demand had capped at this price and format.
Meanwhile, 15 potential one-on-one clients reached out in Q3 asking for higher-touch service, and she turned them down to “focus on the group program” per the January goals.
Lost opportunity:
15 clients who would have paid for one-on-one support.
Each worth about $6,000 per month, which is $90K in missed revenue every month.
Missed for 3 months (July–September), which is $270K left on the table by not pivoting.
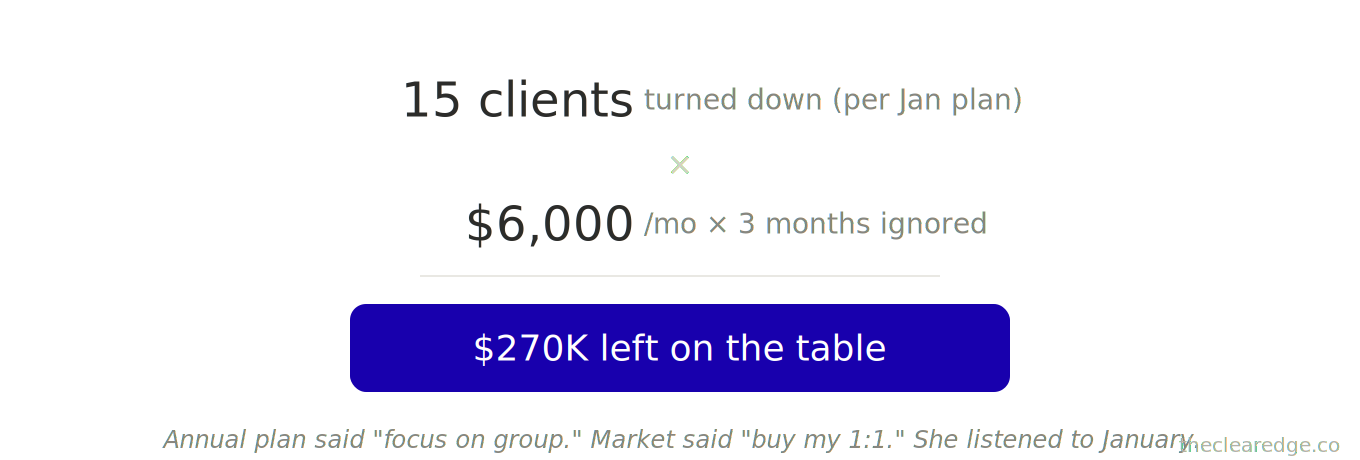
The cost of annual planning without quarterly resets is $270K in a single quarter from strategy drift.
Here’s what fixes it.
Quarterly Wealth Reset Framework for $100K–$150K/Month Founders
The quarterly reset isn’t about abandoning plans—it’s about matching execution to reality every 90 days.
Most founders operate on 12-month cycles: plan in January, execute until December, and wonder why results missed projections.
The shift: 90-day cycles with a mandatory reset between each quarter.
Phase 1: Audit (What’s working/not working)
Review the last 90 days.
Identify:
Winners (double down)
Losers (cut or fix)
Surprises (investigate)
Phase 2: Pivot (Adjust strategy to reality)
Update targets based on actual data.
Shift resources to the highest-return activities.
Kill what’s not working.
Phase 3: Accelerate (Optimize next 90 days)
Set 3 clear objectives for next quarter.
Allocate capacity precisely.
Build metrics-to-action protocols.
Each reset takes 4–6 hours of founder time and returns $20K–$80K in optimized quarterly execution.
The Quarterly Wealth Reset only protects that $100K–$150K/month band if you first see, in hard numbers, which initiatives are winners, losers, and surprises across the last 90 days.
How to Audit the Last 90 Days for Winners, Losers, and Surprises
The audit isn’t about feeling good or bad—it’s about seeing reality clearly so you can optimize.
Audit Structure:
Winners (What exceeded targets)
Which offers generated more revenue than projected?
Which marketing channels delivered better ROI?
Which team members exceeded expectations?
Which systems worked better than expected?
Losers (What underperformed)
Which initiatives missed targets by >20%?
Which activities consumed time without returning value?
Which assumptions proved wrong?
Which systems broke or under-delivered?
Surprises (Unexpected patterns)
What opportunities emerged that weren’t in the plan?
What threats appeared that weren’t anticipated?
What client feedback was repeated across multiple conversations?
What market shifts happened?
Case — Agency at $118K/month auditing Q2
Winners:
LinkedIn content strategy: Projected 8 leads monthly, delivered 19 (+138%).
Senior account manager: Took on 6 clients solo (vs. projected 3–4).
Retention program: Churn dropped from 12% → 6% (50% reduction).
Losers:
Webinar funnel: Projected 15 leads monthly, delivered 4 (–73%).
New service tier: Launched in April, 0 sales in 90 days (market didn’t want it).
Cold outreach: Consumed 40 hours of team time, generated 2 leads ($200+/hour cost per lead).
Surprises:
8 existing clients asked for a recurring retainer model (vs. project-based), creating $68K in monthly revenue potential.
2 competitors shut down, market consolidating.
4 team members expressed interest in specializing (vs. generalist roles).
The audit took 2.5 hours and revealed $68K in monthly opportunity from retainer requests and $15K–$20K in monthly waste from webinars, cold outreach, and the unwanted service tier.
Most founders skip this step; they know intuitively what worked but never quantify it, and the audit forces precision.
Winners → double down
Losers → cut or fix
Surprises → investigate or integrate
Audit the last 90 days with actual numbers. Not feelings. Numbers.
How to Pivot Strategy to Reality by Killing, Shifting, and Doubling Down
After the audit, you have data. Now you pivot—adjust the next 90 days based on what the last 90 days taught you.
Pivot decisions
Kill: Stop activities with negative or minimal ROI.
Shift: Redirect capacity from losers to winners.
Double Down: Increase investment in proven winners.
Most founders resist pivots, telling themselves “But we committed to this” and “But we already invested X hours,” and that sunk cost kills businesses.
The reset forces ruthless resource reallocation based on results, not intentions.
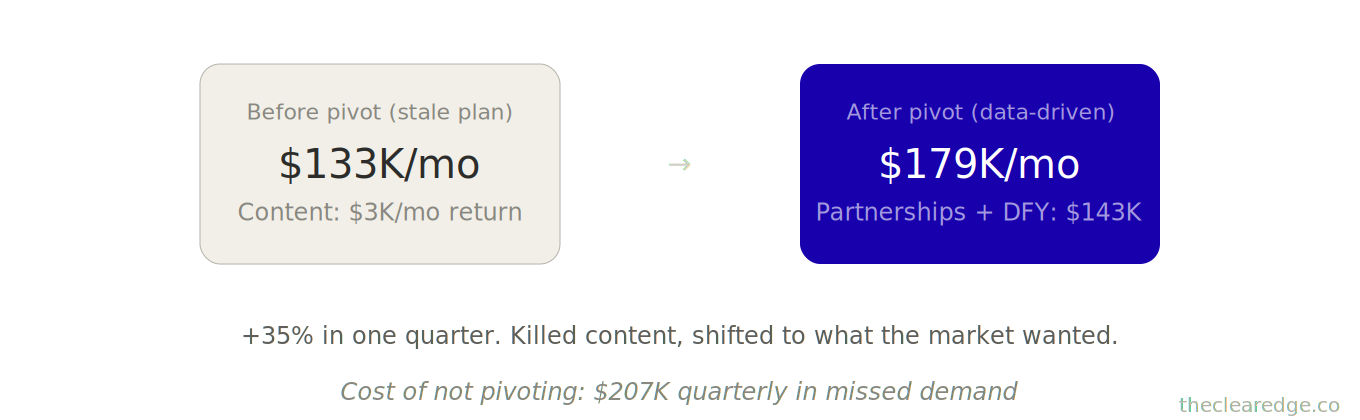
Case study: Consultant at $133K/month pivoting after Q3 audit
Audit revealed:
Winner: Strategic partnerships generated $42K monthly new business (47% of new revenue).
Loser: Content marketing generated $3K monthly after 60 hours of investment ($50/hour return).
Surprise: 12 clients asked for done-for-you implementation (she only offered consulting).
Pivots for Q4
Kill:
Content marketing (stop producing 3 articles weekly).
Cold email campaigns (0.3% response rate), pure waste.
Capacity freed: 15 hours weekly (content + outreach).
Shift:
Redirect 10 hours weekly to partnership development (winning channel).
Redirect 5 hours weekly to building a done-for-you service (unexpected demand).
Double Down:
Partnership pipeline: 4 active partners → target 10 active by end Q4.
Dedicate a mini-CEO to partnership relationship management.
Q4 execution:
Killed content marketing: –$3K monthly short-term, +60 hours capacity freed.
Shifted to partnerships: $42K → $71K monthly from partnerships (doubled investment).
Launched done-for-you tier: 6 clients signed at $12K/month, adding $72K in monthly new revenue.
Q4 revenue: $133K → $179K (+35%) from strategic pivots based on 90-day data.
Without pivot: would have spent Q4 grinding content marketing ($3K monthly return) while ignoring $72K monthly done-for-you demand.
Cost of not pivoting: $69K monthly opportunity cost × 3 months → $207K quarterly.
Pivot based on data, not commitment to old plans.
When $207K can vanish in one quarter without a pivot, the next step is using the Quarterly Wealth Reset to define 3 clear objectives that focus the coming 90 days instead of repeating the mistake.
How to Set 3 Clear Objectives to Accelerate the Next 90 Days
After the pivot, you set the next 90 days’ objectives—not vague goals, specific targets with owners and metrics.
Objective Structure
Objective 1: [Revenue driver]
Target: Specific number
Owner: Founder or mini-CEO
Metric: How you measure success
Actions: 3–5 specific tactics
Timeline: Week-by-week milestones
Objective 2: [Efficiency driver]
Same structure
Objective 3: [Strategic driver]
Same structure
Each objective gets 25–35% of available capacity. No more than 3 objectives (focus beats diffusion).
Case study: Course creator at $111K/month setting Q1 objectives
Objective 1: Launch Tier 2 group program
Target: 25 members by end Q1 ($12,425 monthly at $497/month)
Owner: Founder
Metric: Member count + monthly recurring revenue
Actions:
Build curriculum (Weeks 1–3)
Soft launch to email list (Week 4)
Add 2 live calls weekly (Weeks 5–12)
Iterate based on feedback (ongoing)
Timeline:
Week 4: Launch with 8 members
Week 8: Grow to 15 members
Week 12: Hit 25 members
Objective 2: Delegate all client deliveries
Target: Founder zero hours on delivery by Week 10
Owner: Mini-CEO of Delivery
Metric: Founder delivery hours weekly (track toward 0)
Actions:
Hire senior coach (Weeks 1–2)
Transfer 6 clients (Weeks 3–5)
Transfer remaining 8 clients (Weeks 6–8)
Founder oversight only (Weeks 9–12)
Timeline:
Week 5: 6/14 clients transferred
Week 8: 14/14 clients transferred
Week 10: Founder 0 delivery hours
Objective 3: Build a strategic partnership pipeline
Target: 3 active partnerships generating 15+ leads monthly by the end Q1
Owner: Founder
Metric: Partnership leads monthly
Actions:
Identify 10 potential partners (Week 1)
Outreach to 8 (Weeks 2–4)
Structure 3 pilot partnerships (Weeks 5–8)
Formalize agreements (Weeks 9–12)
Timeline:
Week 4: 8 partnership conversations
Week 8: 3 pilots active
Week 12: 15+ leads monthly from partners
Q1 results:
Objective 1: 28 members (12% over target), generating $13,916 in monthly revenue.
Objective 2: Achieved in Week 9 (ahead of schedule), freeing 18 hours of founder time weekly.
Objective 3: 4 active partnerships (33% over target), generating 22 leads monthly.
Revenue: $111K → $134K (+21% in 90 days)
Founder hours: 52 weekly → 34 weekly (35% reduction)
The precision came from 3 clear objectives with weekly milestones, so every week had a specific target and execution never drifted or became ambiguous.
Set 3 objectives per quarter, track them weekly, and hit targets or pivot mid-quarter when the data demands it.
[Quarterly Objective Check]

For each quarter:

1) Revenue driver set?    [ ]
2) Efficiency driver set? [ ]
3) Strategic driver set?  [ ]

---

For each objective:

- Clear target defined?   [ ]
- Single owner assigned?  [ ]
- Weekly milestones set?  [ ]
Quarterly Wealth Reset In Practice
You’ve seen how a single quarter can drift $270K on stale plans; upgrade to premium to run the exact Quarterly Wealth Reset protocol inside your business every 90 days.
Those 3 Quarterly Wealth Reset moves only compound when they’re locked into a recurring 4–6 hour ritual, so the next section walks through that 90-day protocol step by step.
Quarterly Reset Ritual: 6-Hour Protocol Every 90 Days
Here’s the exact 4–6 hour ritual that runs every 90 days.
Hour 1: Data collection
Pull dashboard metrics for the full quarter
Review revenue by channel, offer, and source
Calculate key metrics: growth %, profit %, capacity utilization
Document wins, losses, surprises
Hour 2: Audit analysis
Categorize every initiative as winner/loser/surprise
Calculate ROI on each major activity
Identify patterns across initiatives
Flag resource misallocations
Hour 3: Pivot decisions
List everything to kill (< $100/hour return or <10% of projected results)
List everything to shift (redirect capacity from losers to winners)
List everything to double down (proven >20% above projections)
Calculate capacity freed by kills + shifts
Hour 4: Next quarter objectives
Set 3 objectives (revenue + efficiency + strategic)
Assign owners (founder or mini-CEO)
Define metrics and milestones
Allocate capacity to each objective
Hour 5: Team alignment
Present audit findings to the team
Communicate pivots and rationale
Brief on new objectives
Get buy-in and questions answered
Hour 6: Systems update
Update dashboard with new metrics
Adjust protocols based on pivots
Communicate changes to all stakeholders
Lock in new quarterly rhythm
Total time:
6 hours once every 90 days
24 hours yearly
0.5 hours weekly averaged
Return: $60K–$240K yearly in optimized execution, avoided drift, and captured opportunities
A service business tracked a reset ROI over 4 quarters:
Q1 Reset: Identified webinar waste (–$18K) and shifted to partnerships (+$31K), producing a $49K net quarterly gain.
Q2 Reset: Killed the underperforming service tier (–60 hours) and launched a retainer model (+$52K monthly), producing a $156K quarterly gain.
Q3 Reset: Doubled down on the best channel (+$23K monthly), producing a $69K quarterly gain.
Q4 Reset: Pivoted to an enterprise focus (+$41K monthly), producing a $123K quarterly gain.
Total yearly value from 4 resets: $397K in optimized execution from 24 hours invested.
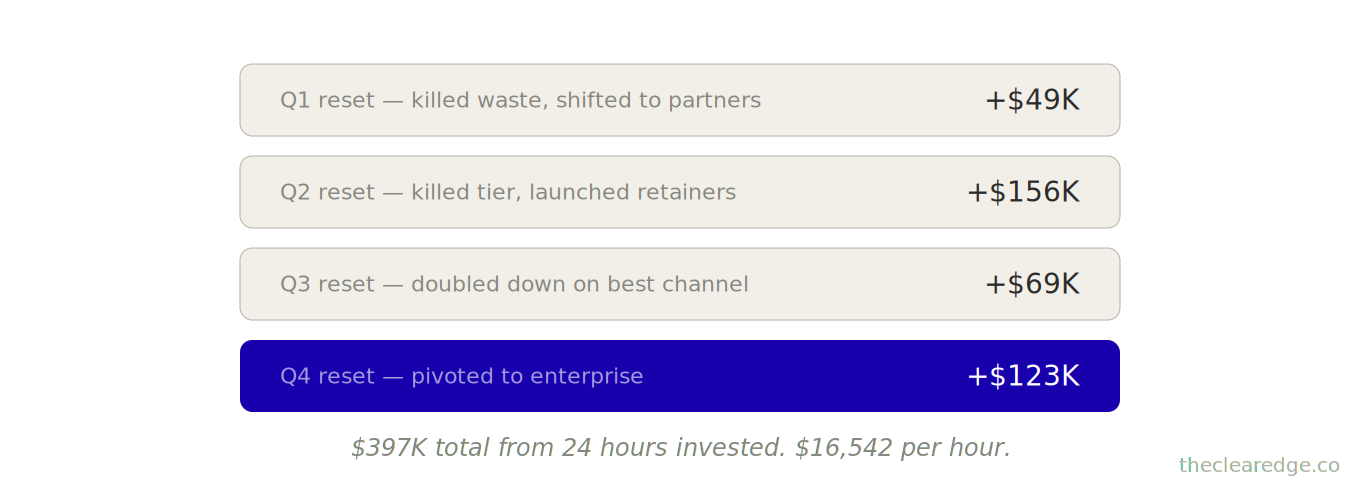
ROI: $16,542 value per hour invested.
Run the ritual. Every 90 days. No exceptions.
[If You Skip Quarterly Reset]

- If strategy drifts 1 quarter: => $45K–$60K average drift
- If pattern repeats 4 quarters: => $180K–$240K+ yearly loss

---

Reset every 90 days
    => Catch drift early
    => Reallocate capacity
    => Capture new opportunities
How Quarterly Wealth Reset Acts as Anti-Drift Insurance
Here’s what the quarterly reset prevents.
Drift Type 1: Strategy-reality mismatch
Pattern: You planned one thing in January, but by April the market wants something else.
Reset: Catches that mismatch 90 days in instead of 270 days in.
Drift Type 2: Resource misallocation
Pattern: You’re spending capacity on low-return activities.
Reset: Reallocates that capacity every 90 days instead of you discovering the waste at year-end.
Drift Type 3: Opportunity blindness
Pattern: Market signals new demand while you’re heads-down executing the old plan.
Reset: Surfaces those surprises every 90 days.
Drift Type 4: Team misalignment
Pattern: Team is executing tactics without understanding strategy shifts.
Reset: Realigns them quarterly instead of letting annual confusion persist.
Drift Type 5: Momentum loss
Pattern: Wins get ignored, energy depletes, and nothing accelerates.
Reset: Celebrates wins and rebuilds momentum every 90 days.
A consultant avoided $180K drift in a single year:
Q1: Reset caught a partnership opportunity 60 days earlier than she would’ve noticed, capturing $36K instead of losing it.
Q2: Reset killed a failed experiment 45 days earlier, saving $28K in wasted capacity.
Q3: Reset reallocated 80 hours from low-return to high-return work, producing $64K in optimized execution.
Q4: Reset doubled down on a winner 90 days earlier, generating $52K in accelerated revenue.
Total drift prevented: $180K yearly from 4 reset sessions, for 24 hours invested.
The reset is anti-drift insurance, costing 6 hours quarterly and preventing $45K–$60K in average quarterly drift.
When $45K–$60K quarterly drift is the baseline risk, the next question is what changes for you over 2–3 quarters as the Quarterly Wealth Reset rhythm settles in and starts paying back.
What Quarterly Wealth Resets Change Over 2–3 Quarters and What They Cost
Implementing quarterly resets requires 2–3 quarters to establish rhythm:
Q1 (First reset): Design the audit framework, run the first reset, set objectives, and track progress.
Time: 8–10 hours (learning curve)
Return: $15K–$30K in gains from immediate pivots
Q2 (Second reset): Refine the framework based on Q1 learnings, run a smoother reset, and set better objectives.
Time: 6–7 hours (getting faster)
Return: $30K–$60K in optimized execution
Q3 (Third reset onward): Ritual established, team aligned, reset runs efficiently.
Time: 5–6 hours (optimized process)
Return: $45K–$80K in captured opportunities + prevented drift
Ongoing maintenance:
6 hours quarterly
24 hours yearly
2 work days total
Cumulative return: $180K–$420K yearly in optimized execution and prevented drift
For a founder at $100K/month:
Investment: 24 hours yearly at $500/hour opportunity cost = $12K
Return: $180K–$420K in optimized quarterly execution
Net gain: $168K–$408K yearly
ROI: $15–$35 value per $1 invested.
One founder’s reflection after 8 quarters of resets: “The reset taught me that strategy isn’t what you plan once—it’s what you adjust every 90 days based on reality.”
[Yearly Reset Math]

Time:

- 6 hours x 4 quarters = 24 hours

Result Range:

- Lower bound: $180K yearly
- Upper bound: $420K yearly

Ask:
Is 24 hours worth preventing $180K+ drift?
When Drift Becomes Your Default
If you stay on 12-month plans at $100K–$150K/month, you’re choosing $180K–$420K drift as normal; block the 6 hours and start the Quarterly Wealth Reset instead.
Run Your Quarterly Wealth Reset Scoring Gate Checklist
Block this every time you reserve 6 hours to close a quarter and reset the next 90 days.
☐ Pulled full-quarter revenue, channel, offer, and capacity metrics, then wrote winners/losers/surprises for all initiatives using your 90-day audit structure.
☐ Calculated ROI for each initiative, flagged anything under $100/hour or delivering under 10% of projected results as losers in your audit notes.
☐ Listed everything to kill, shift, and double down, then logged total capacity freed by kills + shifts for the coming 90 days.
☐ Wrote 3 Quarterly Wealth Reset objectives (revenue, efficiency, strategic) with specific targets, single owners, and weekly milestones for the next quarter.
☐ Checked that the full Quarterly Wealth Reset ritual stayed within 4–6 hours, recorded drift prevented or upside captured against the $180K–$420K yearly range.
Every run catches drift before it compounds into another $45K–$60K quarter or $180K–$420K year lost to stale January plans
How to Schedule and Run Your First Quarterly Wealth Reset
Hold this when you’re closing a quarter and ready to reset the next 90 days with a full Quarterly Wealth Reset pass.
Schedule your first reset for the end of this quarter. Block 6 hours in the final week of the quarter.
Run the audit. Pull actual numbers from the last 90 days. Categorize winners, losers, and surprises.
Make pivots. Kill what’s not working. Shift capacity to winners. Set 3 clear objectives for the next 90 days.
The shift from annual planning to quarterly resets typically shows measurable impact within 2 quarters, as the first reset catches 1–2 major drifts, the second reset improves execution, and the third reset onward becomes a natural rhythm.
FAQ: Quarterly Wealth Reset
Q: How do I know if I actually need a Quarterly Wealth Reset instead of just “better planning”?
A: You need it when you’re around $100K–$150K/month, still following your January plan in July, and can point to at least one stalled initiative and one ignored opportunity from the last 90 days.
Q: How does the Quarterly Wealth Reset prevent the $180K–$420K yearly drift this article warns about?
A: It uses a 6-hour ritual every 90 days—Audit, Pivot, Accelerate—to classify winners/losers/surprises, reallocate capacity, and set 3 clear quarterly objectives so misaligned strategies get corrected in 90 days instead of 270.
Q: How do I run the Audit phase so I stop guessing what worked and what didn’t?
A: In 2–2.5 hours you review the last 90 days of revenue, channels, offers, and capacity, then label each initiative as winner, loser, or surprise like the $118K/month agency that uncovered a $68K/month retainer opportunity and $15K–$20K/month in wasted webinars and cold outreach.
Q: How do I use the Pivot phase to avoid another $270K mistake like the stalled group program example?
A: You kill losers (like an $18K/month webinar funnel), shift freed hours to winners, and double down on surprise demand—such as the coach who should have moved those hours from a capped 20-person group into $90K/month one-on-one demand instead of grinding on the original plan for another quarter.
Q: How do I set the 3 Quarterly Wealth Reset objectives so each 90-day cycle actually moves revenue?
A: You pick one revenue driver, one efficiency driver, and one strategic driver with specific targets, owners, and weekly milestones, as in the $111K/month course creator who set a 25-member group goal, full delivery delegation, and 3 active partnerships and ended the quarter at $134K with hours cut from 52 to 34 per week.
Q: How much time does a full Quarterly Wealth Reset really take once I’ve done it a couple of times?
A: After the first 8–10 hour run-in, resets stabilize at 5–6 hours every 90 days—about 24 hours per year—split across data collection, audit analysis, pivot decisions, objective setting, team alignment, and systems updates.
Q: What does the Quarterly Reset Ritual look like week-by-week inside my business?
A: In Week 12 you invest 6 hours to pull metrics, audit winners/losers/surprises, decide what to kill/shift/double down, set 3 objectives, align the team, and update dashboards so Weeks 1–12 of the next quarter execute against fresh, reality-checked priorities instead of stale January assumptions.
Q: How does the Quarterly Wealth Reset interact with The Clear Edge OS so my systems compound instead of fragment?
A: Each reset checks your five layers (Signal, Execution, Capacity, Time, Energy), surfaces which system—like Bottleneck Audit, Delegation Map, or Time Fence—is underutilized, and assigns one system upgrade as part of your 3 quarterly objectives so improvements stack every 90 days.
Q: What happens if I keep running on annual plans without quarterly resets at $100K–$150K/month?
A: You repeat the $126K/month coach’s path—6–8 months pushing a stalled program while ignoring $90K/month of one-on-one demand, turning a fixable Q3 pivot into a $270K loss from a single quarter of drift, and potentially $180K–$420K per year if the pattern repeats.
Q: How much ROI can I expect from committing to four Quarterly Wealth Resets over the next year?
A: A service business that ran 4 resets logged about $397K in yearly value—$49K, $156K, $69K, and $123K gains across four quarters—from 24 hours invested, an effective $16,542 per hour or $15–$35 in return for every $1 of time and attention spent.
Next Ceiling: Add Revenue Without Adding Founder Hours
Next article covers “The Next Ceiling: Add $50K Revenue Without Adding 10 Hours for $120K–$140K Operators.” I will show you specific strategies that break through the $100K ceiling toward the next revenue level.
Navigate The Clear Edge OS Systems for Scaling From $5K to $150K
Start here: The Complete Clear Edge OS — Your roadmap from $5K to $150K with a 60-second constraint diagnostic.
Use daily: The Clear Edge Daily OS — Daily checklists, actions, and habits for all 26 systems.
LAYER 1: SIGNAL (What to Optimize)
The Signal Grid • The Bottleneck Audit • The Five Numbers
LAYER 2: EXECUTION (How to Optimize)
The Momentum Formula • The One-Build System • The Revenue Multiplier • The Repeatable Sale • Delivery That Sells • The 3% Lever • The Offer Stack • The Next Ceiling
LAYER 3: CAPACITY (Who Optimizes)
The Delegation Map • The Quality Transfer • The 30-Hour Week • The Exit-Ready Business • The Designer Shift
LAYER 4: TIME (When to Optimize)
Focus That Pays • The Time Fence
LAYER 5: ENERGY (How to Sustain)
The Founder Fuel System • $100K Without Burnout
INTEGRATION & MASTERY
The Founder’s OS • The Quarterly Wealth Reset
AMPLIFICATION (AI & Automation)
The Automation Audit • The Automation Stack
⚑ Found a Mistake or Broken Flow?
Use this form to flag issues in articles (math, logic, clarity) or problems with the site (broken links, downloads, access). This helps me keep everything accurate and usable. Report a problem →
› More to Explore: Quick Navigation · The Clear Edge OS
➜ Help Another Founder, Earn a Free Month
If this system just saved you from drifting past another $180K–$420K this year on stale plans, share it with one founder who needs that relief.
When you refer 2 people using your personal link, you’ll automatically get 1 free month of premium as a thank-you.
Get your personal referral link and see your progress here: Referrals
Get The Quarterly Wealth Reset Toolkit for $100K–$150K/Month Founders
You’ve read the system. Now implement it.
Premium gives you:
Ready-to-use PDF toolkit—every template, diagnostic, and formula pre-filled, zero setup, immediate use
Plug-and-play AI diagnosis sessions—drop into Claude, Gemini or ChatGPT, answer a few questions, save hours of guessing, get your exact next move
Audio key points—concentrated frameworks you can absorb in minutes, implement while you move
Unrestricted access to the complete library—every system, every update
What this prevents: Letting 6–8 months drift on January plans and leaking $180K–$420K instead of resetting every 90 days.
What this costs: $12/month. Run the full Quarterly Wealth Reset with templates instead of building it from scratch.
Download everything today. Implement this week. Cancel anytime, keep the downloads.
Already upgraded? Scroll down to download the PDF, audio, and your AI session.
