
The One-Build System: Create Once, Sell to 100 Clients for $30K–$50K Operators
For $30K–$50K/month founders capped at 9–15 clients, The One-Build System in The Clear Edge OS framework converts 10–12 system-building hours into scalable capacity and revenue.


The Executive Summary
Founders at $30K–$50K/month quietly lose $75K–$150K a year by rebuilding the same work; shifting to the One-Build System in the Clear Edge OS turns every repeat task into an asset that can serve 100 clients.
Who this is for: Consultants, coaches, and agency founders at $30K–$50K/month working 50–56 hour weeks, capped at 9–15 clients because onboarding, proposals, reports, and check-ins are rebuilt from scratch.
The One-Build Problem: Rebuilding delivery eats 18–29 hours weekly, wastes $75K–$150K+ in annual capacity, and keeps revenue stuck at $36K–$42K even when there are 8–11 inbound leads waiting.
What you’ll learn: A punchy One-Build System that documents repeats, turns them into reusable templates, recordings, and automations, and tracks a Systems Leverage Ratio so every system returns 10–80+ hours per hour invested.
What changes if you apply it: Rebuild hours drop from 23–29 → 2–6, weekly capacity jumps by 18–29 hours, client counts climb from 9–15 → 18–22, and revenue rises from $33K–$42K → $48K–$56K+ without longer weeks.
Time to implement: Expect 2 weeks of light tracking and 10–12 hours of system building, with 18–29 hours weekly freed inside 30–90 days and $80K–$150K+ in recovered capacity over 12 months.
Written by Nour Boustani for $30K–$50K/month founders who want $48K–$56K scalable revenue without 60-hour weeks, rebuild burnout, or leaving six figures trapped in repeated work.
Founders at $30K–$50K/month stay capped because rebuild hours quietly erase capacity. To run The One-Build System in The Clear Edge OS properly, upgrade to premium and install the full toolkit.
› Library Navigation: Quick Navigation · The Clear Edge OS
Why Revenue Caps at $42K for $30K–$50K Service Founders Rebuilding Delivery
Hitting $42K and staying there usually looks the same: delivery expands, systems don’t, and the calendar silently fills with rebuild work.
Two months ago, I talked to a consultant who made $42,000/month from 14 clients, each paying $3,000, working 56 hours per week.
Every client onboarding felt custom. Every proposal started from scratch. Every monthly report was rebuilt from zero.
Revenue hit a wall, not from lack of demand—he had eight leads waiting—but he couldn’t take them because delivery consumed all available time.
“I’m maxed out,” he said. “If I add more clients, quality drops, or I burn out.”
Classic trap.
I asked him to document one week of delivery work, hour by hour, capturing what he actually created versus what could be reused.
What We Found in a Weekly Rebuild Audit at $42K Months:
Here’s what we found:
Here’s what we found:
Client onboarding
Spent 4 hours per new client explaining the same process, answering the same questions, setting up the same systems.
Three new clients monthly → 12 hours rebuilding identical work.
Monthly reports
Spent 2 hours per client creating reports with the same structure, same metrics, different numbers.
14 clients → 28 hours monthly reformatting the same template.
Strategy calls
Spent 15 minutes per call taking notes, then 30 minutes after writing summary emails. Same format every time.
56 calls monthly → 42 hours of redundant documentation.
Proposal creation
Spent 3 hours per proposal writing services, pricing, and process from scratch.
Six proposals per month → 18 hours spent recreating identical content.
Total rebuild hours
100 hours monthly → 23 hours weekly spent recreating work that should exist once.
His effective capacity with and without one-build delivery systems
Current: 56 hours weekly - 23 rebuild hours → 33 hours of actual new work.
Potential: 56 hours weekly - 2 rebuild hours (with systems) → 54 hours of actual new work.
The gap: 21 hours weekly × 4.33 weeks → 91 hours monthly
At his $75/hour delivery rate → $6,825 monthly in wasted capacity
Over 12 months: $81,900 in lost capacity from rebuilding instead of reusing
“I thought customization showed I cared,” he said. “That every client deserved unique attention.”
Wrong framework.
Unique attention comes from solving their specific problem, not from reinventing your delivery process. Templates don’t reduce quality; they protect it by ensuring nothing gets forgotten and best practices get applied consistently.
His real problem wasn’t effort. It was architecture.
We rebuilt his business around one rule: build once, use forever. Every repeated task becomes a system.
One-build changes that cut 21 weekly rebuild hours for a $42K consultant
Created client onboarding video
Filmed once (45 minutes)
Sent to every new client
Built proposal template with six service tiers
2 hours to create
15 minutes to customize per lead
Designed a monthly report template in a spreadsheet
Client data auto-fills from tracking
10 minutes per report instead of 2 hours
Recorded strategy call note template (fill-in-the-blank format)
5 minutes instead of 30 minutes
Built an FAQ document answering the 12 most common questions
Sent before first call
Eliminated 80% of repetitive questions
Four-week timeline to free 21 hours and add $12K monthly revenue:
Week 1: Built onboarding video + FAQ document
Week 2: Created proposal template + tested with three leads
Week 3: Designed report template + migrated 14 clients
Week 4: Systemized call notes + documentation process
Month 2: Freed 21 hours weekly without increasing total hours worked, took on four new clients
Month 3: Revenue hit $54,000 (+$12K from baseline)
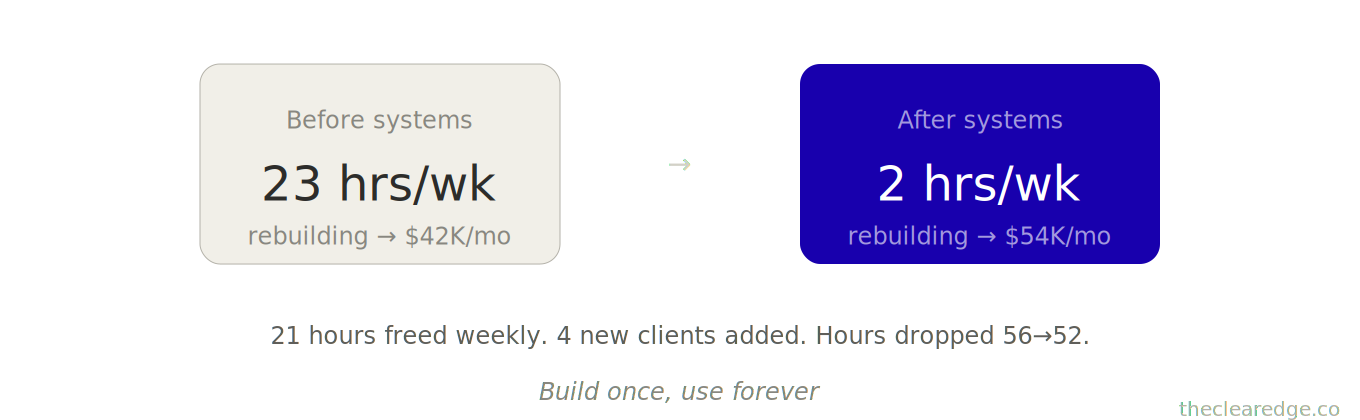
Hours/week: 56 → 52
Rebuild hours: 23 → 2
Clients: 14 → 18
Revenue: $42K → $54K (+$12K)
He didn’t work more. He built once instead of rebuilding constantly.
Growth didn’t come from adding hours. It came from building once instead of rebuilding forever.
The Rebuild Pattern That Kills Scale at $30K–$50K for Agencies and Coaches
Now that you’ve seen leverage in action, here’s why most founders stay trapped in rebuild mode.
The pattern
Every founder at $30K–$50K is rebuilding something they’ve already built, across proposals, reports, onboarding, and calls. The pattern is identical across businesses: they treat every client interaction like it’s the first time instead of the hundredth.
What the data shows
Across 41 businesses I’ve audited at this revenue stage, 73% spend 18–28 hours weekly recreating work that should be systematized, costing $75K–$140K annually in lost capacity.
That lost time is what quietly caps revenue, because repeated work without systems hits the founder’s rebuild limit long before the market hits demand.
The shift: You grow by stopping the rebuild cycle
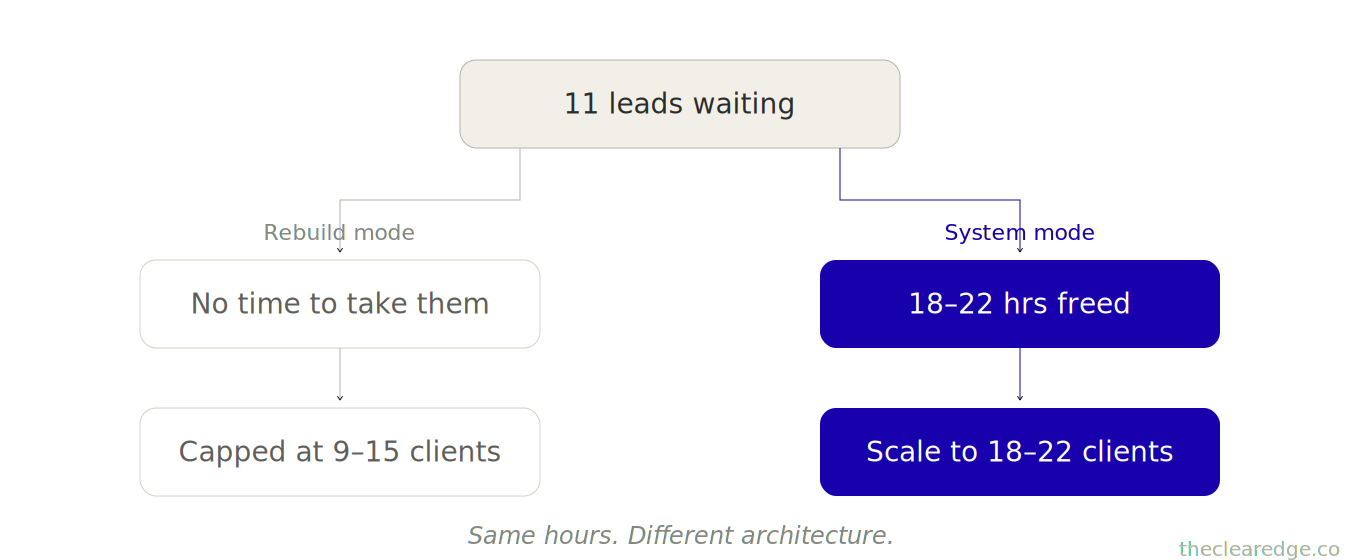
An agency owner was earning $36,000/month from nine clients, each paying $4,000, and working 53 hours per week, with 11 inbound leads he couldn’t take. Delivery consumed everything.
His weekly rebuild pattern blocking 11 additional clients at $36K months
Client kickoff calls: 3 hours (same presentation, different audience)
Project briefs: 5 hours (same template structure, written from scratch each time)
Status updates: 4 hours (same format emailed individually)
Revision rounds: 8 hours (explaining the same feedback patterns repeatedly)
Invoice creation: 2 hours (manually calculating, formatting, sending)
Total: 22 hours weekly rebuilding identical processes.
Current capacity math before one-build systems
53 hours weekly - 22 rebuild hours = 31 hours actual delivery capacity
31 hours ÷ 9 clients = 3.4 hours per client weekly
At 3.4 hours, he could serve 15 clients maximum before hitting capacity
Capacity math after installing one-build systems for delivery
53 hours weekly - 3 rebuild hours (with templates) → 50 hours actual delivery
50 hours ÷ 3.4 hours per client → 15 clients at current service level
Or 50 hours ÷ 2.5 hours (more efficient with systems)→ 20 clients
The gap:
20 - 9 = 11 additional clients possible
11 × $4,000 = $44,000 monthly additional revenue capacity locked behind rebuild work
The revenue ceiling wasn’t demand; it was a delivery architecture problem. We didn’t change his service. We systematized his delivery.
Delivery changes that turned 22 rebuild hours into $20K more monthly revenue
Recorded one client kickoff video explaining process, timeline, expectations
Sent before first call
35 minutes to create
Eliminated 80% of kickoff meeting time
Built project brief template with 12 standard sections
Fill in client specifics
30 minutes instead of 5 hours
Created automated weekly status email pulling from project management tool
5 minutes weekly instead of 4 hours
Documented 8 most common revision requests with standard response templates
Copy-paste-customize
15 minutes per round instead of 1 hour
Set up invoicing automation through accounting software
Auto-generates
2 minutes to review instead of 2 hours to create
Four-week one-build implementation timeline for an agency owner
Week 1: Recorded kickoff video + built brief template
Week 2: Set up automated status updates
Week 3: Created revision response library
Week 4: Automated invoicing
Month 2: Freed 18 hours weekly, onboarded three new clients
Month 3: Added two more clients, revenue hit $56,000 (+$20K)
Results:
Hours/week: 53 → 51
Rebuild hours: 22 → 4
Clients: 9 → 14
Revenue: $36K → $56K (+$20K)
Same service. Systemized delivery. Revenue uncapped.
Another coach was stuck at $33,000/month from 15 clients at $2,200 each.
Every discovery call required one hour of custom research.
Every client got a personalized welcome packet that she spent two hours creating.
Every week, she wrote individual check-in emails, each taking 45 minutes.
Felt meaningful. Was unsustainable.
Her weekly rebuild pattern wasting 29 hours on low-value customization
Discovery call prep: 8 hours (researching each prospect’s business individually)
Welcome packet creation: 6 hours (custom designing for 3 new clients monthly)
Weekly check-in emails: 11 hours (15 clients × 45 minutes)
Resource recommendations: 4 hours (researching and compiling custom lists per client need)
Total: 29 hours weekly on customization that didn’t improve outcomes.
She thought custom meant better. Data showed otherwise.
Client satisfaction survey results that exposed low-value custom work
Clients valued: Accountability structure (94%), specific frameworks (89%), progress tracking (86%)
Clients mentioned custom research: 12%
Clients mentioned personalized packets: 8%
She was investing 29 hours weekly in work that 8-12% of clients noticed, while under-investing in systems that 86-94% valued.
Wrong allocation.
How we systematized the high-value work and dropped rebuild hours
Built discovery call framework with 15 standard questions (no custom research needed, 15 minutes prep instead of 1 hour)
Created one welcome packet template with client name/goal variables (20 minutes to customize instead of 2 hours)
Designed a weekly check-in template with 5 progress prompts (fill-in-the-blank, 10 minutes per client instead of 45 minutes)
Curated primary resource library organized by common challenges (send relevant section, 5 minutes instead of 4 hours of custom research)
Results after 90 days of running the one-build system in a coaching business
Weekly rebuild hours: 29 → 6
Freed capacity: 23 hours weekly → 100 hours monthly
New clients added: 7 (filled capacity with systematized delivery)
Client satisfaction: 8.2/10 → 8.7/10 (better structure improved outcomes)
Hours/week: 48 → 47
Rebuild hours: 29 → 6
Clients: 15 → 22
Revenue: $33K → $48,400 (+$15,400)
Customization dropped. Quality improved. Revenue grew.
The pattern is simple: founders confuse customization with quality. Real quality comes from consistently applying proven systems, not from reinventing delivery for each client.
Systems create quality. Rebuilding creates chaos.
The $75K–$150K Capacity Leak From 18–29 Weekly Rebuild Hours
You’ve just seen how 18–29 rebuild hours a week quietly burn $75K–$150K a year. If you’re ready to treat that like a fixed system problem, upgrade to premium and get the layer that keeps it closed.
The One-Build System Framework Inside The Clear Edge OS for $30K–$50K Founders
Here’s the three-move framework to stop rebuilding and start scaling.
This isn’t theory. It’s the exact process that freed 18-29 hours weekly for the founders above and enabled $12K-$20K monthly revenue growth within 90 days.
The One-build framework: Three moves to turn rebuild work into systems
Move 1: Document the Repeat (Find what you’re rebuilding)
Move 2: Template the Delivery (Turn custom into systematic)
Move 3: Measure the Multiplier (Track compounding returns)
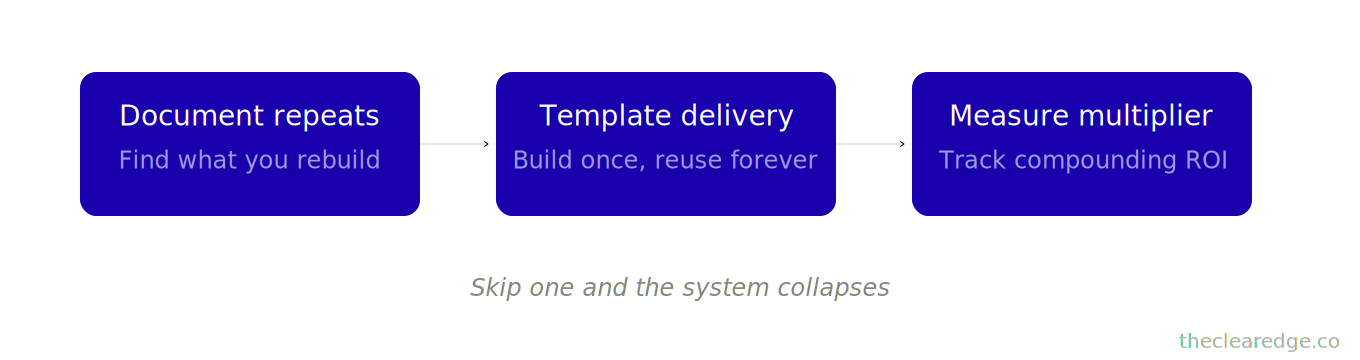
Each move builds on the previous. Skip one, the system collapses.
Most founders at $30K–$50K/month can see the rebuild problem but still don’t know exactly what they’re recreating. The first move turns that vague friction into a concrete list you can act on.
Move 1: Document the Repeat to Find 16–32 Weekly Rebuild Hours
Most founders can’t systematize because they don’t know what to systematize.
They feel busy and know they’re recreating work, but they can’t pinpoint exactly what’s getting rebuilt or how much time it actually consumes.
The mechanism: without documentation, repeated work stays invisible. What’s invisible can’t be systematized, and what isn’t systematized keeps consuming time forever.
Start with brutal honesty about what you’re rebuilding.
A course creator was making $39,000/month but couldn’t scale.
“I’m always building something,” she said. “But I can’t tell you what.”
We tracked her deliverables for two weeks. Not calendar blocks. Actual outputs created.
What she rebuilt weekly before installing one-build systems
Student welcome emails: 8 sent, each written from scratch, 30 minutes each → 4 hours
Module introduction videos: 6 recorded, each with a custom intro explaining the same course structure → 5 hours
Q&A responses: 47 questions answered, 31 were identical to previous questions asked → 9 hours
Progress check-ins: 12 clients, same structure of questions, individually typed → 6 hours
Feedback on assignments: 14 pieces, same core feedback repeated across submissions → 8 hours
Total rebuild time: 32 hours across 14 days = 16 hours weekly
Her response: “I had no idea it was that much.”
Visibility creates opportunity. Once she saw the pattern, she could fix it.
How to document your repeats in two weeks to find system candidates
Week 1: Raw tracking
Track every deliverable you create for 7 days. Not time blocks—actual outputs.
What you created
Who it was for
How long did it take
Whether you’ve created something similar before
Week 2: Pattern recognition
Review your tracking. Look for:
Identical deliverables created multiple times
Proposals
Onboarding emails
Reports
Similar structure with different content
Discovery calls
Client updates
Feedback
Processes you explain repeatedly
How your service works
What happens next
Common questions
Classification
For each repeated item, classify:
Template candidate: Same structure, different details
Proposals
Reports
Emails
Recording candidate: Same explanation, different audience
Onboarding
Process walkthrough
FAQ
Automation candidate: Same steps, no judgment needed
Scheduling
Invoicing
Reminders
One consultant tracked 10 days and found:
19 instances of explaining his process to prospects (template candidate)
13 instances of the same monthly report structure (template candidate)
8 instances of identical follow-up emails after discovery calls (template candidate)
5 instances of explaining the deliverables timeline (recording candidate)
Track every deliverable you create for 7 days. Not time blocks—actual outputs.
Process explanation: 19 × 25 minutes → 475 minutes → 7.9 hours monthly
Monthly reports: 13 × 90 minutes → 1,170 minutes → 19.5 hours monthly
Follow-up emails: 8 × 20 minutes → 160 minutes → 2.7 hours monthly
Timeline explanation: 5 × 15 minutes → 75 minutes→ 1.25 hours monthly
Total: 31.35 hours monthly spent rebuilding four systemizable processes
Once documented, the path forward becomes obvious. You can’t optimize what you can’t see.
Edge case: “What if my work is actually custom every time?”
Test it. Most founders believe their work is unique, but most are mistaken; the framework is repeatable even when details change.
One designer insisted every project was different. We tracked 15 projects and found the opposite.
12 of 15 used the same discovery process
14 of 15 went through identical revision rounds
15 of 15 had the same deliverable structure (mockup → revision → final)
11 of 15 received identical feedback in round one
The surface looked custom, but the structure was identical.
Your rebuild audit: 20-minute exercise to surface one-build opportunities
Spend 20 minutes right now listing everything you’ve created in the past 7 days that you’ve created before in some form. Don’t filter; just list it.
That list is your systematization roadmap.
Once you’ve surfaced 16–32 hours of repeated work, the constraint isn’t awareness anymore. The next move is turning those repeats into assets that cut rebuild time instead of just describing it.
Move 2: Template the Delivery to Stop Rebuild Work at $30K–$50K
Once you know what you’re rebuilding, the next step is building it once in a way that works forever.
This isn’t about reducing quality; it’s about embedding your best thinking into reusable systems so quality stays high while time investment drops.
Templates, recordings, and automations remove rebuild time while maintaining consistency. A well-built system ensures nothing gets forgotten and best practices are applied every time.
Case: proposal rebuild trap
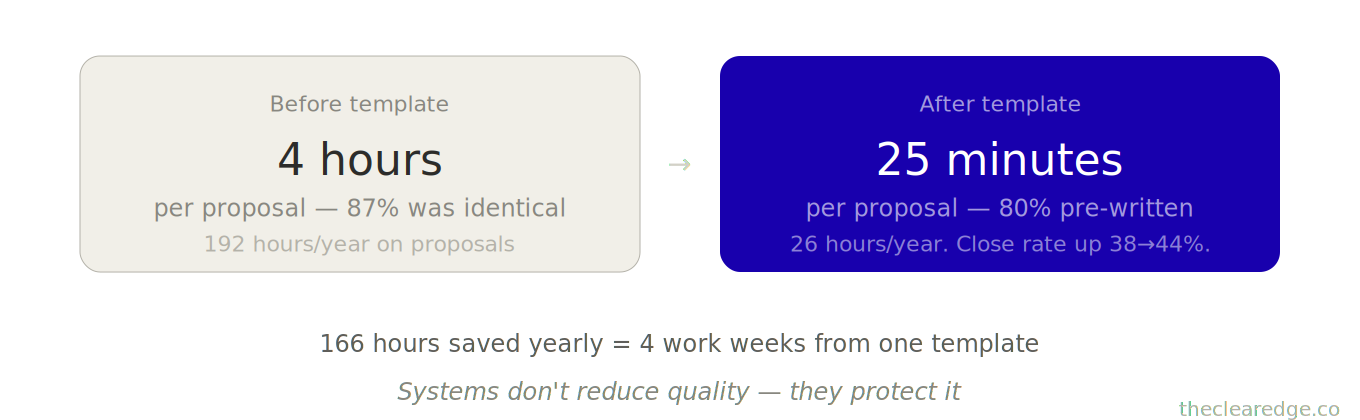
An agency owner was rebuilding client proposals weekly. Each took 4 hours because he believed custom showed he cared.
We analyzed 12 proposals he’d sent. Found:
87% of the content was identical (services offered, process, timeline, terms)
9% was client-specific (name, industry, specific goals)
4% was project-specific (pricing, timeline adjustments)
He was spending 4 hours to customize 13% of the content.
Wrong effort allocation.
We built a proposal template:
Core services section: written once, covers 80% of what he offers
Process walkthrough: written once, explains timeline and milestones
Case study section: three pre-written examples, choose the most relevant
Pricing tiers: six standard packages. Select the appropriate tier
Variable fields: Client name, industry, specific goals, custom pricing if needed
Time to create template: six hours once
Time to customize per proposal: 25 minutes (down from 4 hours)
Math over 12 months: One proposal template’s time and revenue return
Proposal time shift
Before: 4 hours × 4 proposals monthly × 12 months → 192 hours yearly
After—6 hours template creation: 25 minutes × 48 proposals → 20 hours 26 hours yearly
Result:
Time saved: 192 − 26 = 166 hours → 4.15 work weeks
Recovered capacity: at $150/hour = $24,900 yearly from one template.
Quality didn’t drop. The close rate increased from 38% to 44% because the template ensured he never forgot key information and consistently covered objections.
Systems improve outcomes.
Another consultant spent 2.5 hours per client creating monthly progress reports. With 12 clients, that meant 30 hours monthly on reports.
We analyzed 8 months of reports. Structure was identical:
Progress summary (what got done)
Metrics update (before/after numbers)
Next month’s priorities (what’s coming)
Blockers/concerns (what needs attention)
Only the data changed. The structure stayed the same.
We built a report template in Google Sheets:
Client name: auto-filled from tracker
Month/date: auto-generated
Progress metrics: pulled from tracking sheet (he was already tracking, just copying manually)
Summary sections: fill-in-the-blank format with prompts
Next priorities: checklist format (check relevant items)
Time to build template: 3 hours
Time per report after template: 15 minutes (down from 2.5 hours)
The math: How one reporting template saves 321 hours a year
Before:
2.5 hours × 12 clients = 30 hours monthly
30 hours monthly = 360 hours yearly
After:
3 hours template
15 minutes × 144 reports yearly = 36 hours
3 + 36 hours = 39 hours yearly
Time Saved and Annual Capacity Reclaimed From Report Systematization
321 hours = 8 work weeks
At his $120/hour rate: $38,520 yearly from one spreadsheet template.
Client feedback improved:
“Reports are clearer now,” one said. “I can see patterns better.”
Consistency compounds.
Template types that multiply time for service, coaching, and agency founders
Communication templates:
Discovery call follow-up emails
Proposal delivery messages
Welcome emails for new clients
Weekly/monthly update emails
Offboarding/completion messages
Delivery templates:
Project briefs
Strategy documents
Monthly/quarterly reports
Meeting agendas
Call note formats
Process recordings:
Client onboarding walkthrough
Service explanation video
FAQ response library
Tool setup tutorials
Common process demonstrations
Decision frameworks:
Client fit assessment
Project scope definitions
Pricing tier selection
Timeline estimation
Resource allocation
A coach built 5 core templates over 12 hours:
1. Discovery call question framework
2 hours to create
15 minutes to use
2. Client onboarding video
3 hours to record/edit
Eliminates 45-minute live onboarding
3. Weekly check-in template
1 hour to build
10 minutes per client
4. Resource library by challenge type
4 hours to organize
5 minutes to share relevant section
5. Progress tracking spreadsheet
2 hours to design
5 minutes to update
Investment: 12 hours once to build five core one-build templates
Weekly time saved:
Discovery calls: 6 calls × 45 minutes saved = 4.5 hours
Onboarding: 2 clients × 35 minutes saved = 1.2 hours
Check-ins: 18 clients × 35 minutes saved = 10.5 hours
Resource sharing: 8 instances × 20 minutes saved = 2.7 hours
Tracking: 18 clients × 5 minutes saved = 1.5 hours
Total weekly savings: 20.4 hours
ROI on a 12-hour investment: 20.4 hours saved weekly, becoming 1,056 hours saved yearly.
Systems leverage ratio (hours saved ÷ hours invested): 1,056 ÷ 12 = 88:1
Every hour invested in templates returned 88 hours of capacity over one year.
This is multiplication.
Your template sprint: build one one-build asset this week and track time saved.
Choose one thing you’ve created 3+ times in the past month, build a template for it this week, track the time you save, and compound from there.
Move 3: Measure Systems Leverage and Time Multipliers With a Simple Tracker
Templates only work if you actually use them and track their impact.
Most founders build systems, then forget they exist or revert to custom work because they’re not measuring the return.
When you track time saved per system, you create motivation to use it, build more, and avoid abandoning it.
An agency owner built 8 templates over 4 weeks and used 3 of them consistently; the other 5 sat unused.
“I forgot I had them,” he said. “And I couldn’t tell if they were actually helping.”
No measurement. No motivation. No adoption.
We built a systems tracker to quantify one-build ROI
System name
Date created
Hours invested to build
Hours saved per use
Times used this month
Total hours saved
ROI (hours saved ÷ hours invested)
What the systems tracker revealed about proposal, onboarding, and report ROI
Proposal template:
Hours to build: 5
Hours saved per use: 3.5
Times used: 4 monthly
Total saved: 14 hours monthly → 168 hours yearly
ROI: 168 ÷ 5 = 33.6:1
Client onboarding video:
Hours to build: 2
Hours saved per use: 0.75
Times used: 3 monthly
Total saved: 2.25 hours monthly → 27 hours yearly
ROI: 27 ÷ 2 = 13.5:1
Monthly report template:
Hours to build: 3
Hours saved per use: 2
Times used: 9 monthly
Total saved: 18 hours monthly → 216 hours yearly
ROI: 216 ÷ 3 = 72:1
Once he saw the numbers, he used the system every week. Built 4 more in the next month.
Cumulative impact after 6 months of tracking systems leverage
Systems built: 12
Total hours invested: 31
Total hours saved monthly: 47
Annual capacity reclaimed: 564 hours → 14 work weeks
At a $135/hour rate: $76,140 yearly from 31 hours of system building
Systems leverage ratio example: 564 hours saved from 31 hours invested (18.2:1)
Every hour spent building systems returned 18.2 hours of capacity.
Another consultant tracked systems for 90 days
Month 1: early one-build ROI while payback is in progress
Built: 3 templates (proposal, onboarding email, discovery questions)
Hours invested: 8
Hours saved: 12 monthly
ROI: Still negative (payback in progress)
Month 2: compounding systems leverage as more templates come online
Built: 2 more templates (status update, project brief)
Hours invested: 5
Hours saved: 21 monthly (cumulative)
ROI:
21 × 2 months → 42 hours saved
42 hours saved ÷ 13 invested → 3.2:1
Month 3: crossing 4.9:1 ROI with nine active one-build systems
Built: 2 templates (call notes, resource library)
Hours invested: 4
Hours saved: 28 monthly (cumulative)
ROI:
28 × 3 months → 84 hours saved
84 hours saved ÷ 17 invested → 4.9:1
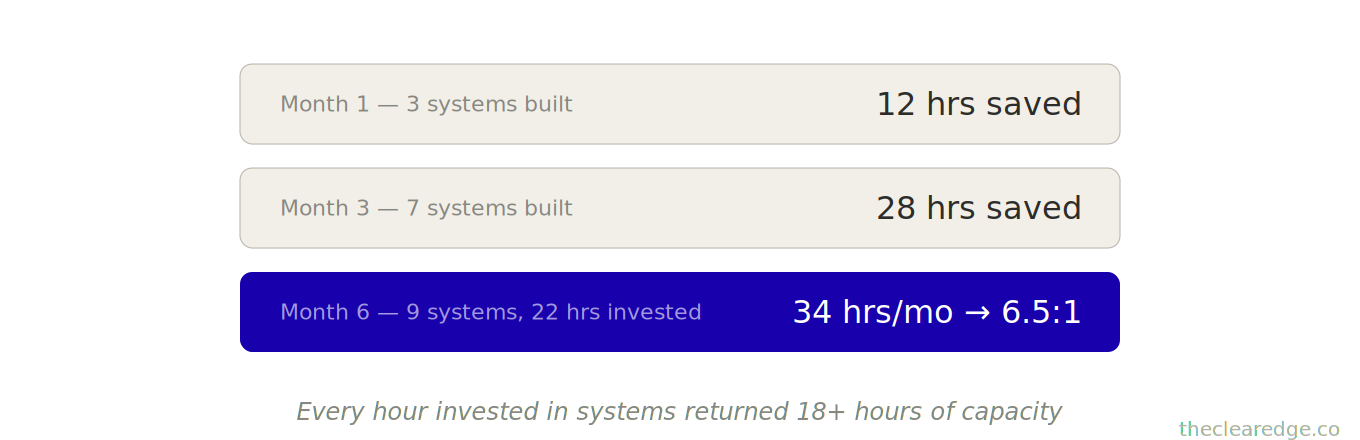
By month 6: nine systems saving 34 hours monthly from 22 hours built
Total systems: 9
Total invested: 22 hours
Total saved monthly: 34 hours
Cumulative saved (6 months): 144 hours
ROI: 144 ÷ 22 = 6.5:1
Projection for year 1: 408 hours and $57K in capacity from one-build systems
34 hours saved monthly × 12 → 408 hours yearly
At a $140/hour rate: $57,120 in recovered capacity from 22 hours of system building
The compounding accelerates. Systems built in month 1 keep paying returns.
What to measure weekly to prove one-build systems are working
Track these 4 metrics weekly:
Systems used this week (ensures adoption)
Hours saved per system (proves value)
New systems built (tracks progress)
Cumulative capacity reclaimed (shows compound effect)
Capacity reclaimed: 264 hours → 6.6 work weeks in 90 days
That’s 6.6 weeks of time freed without hiring, delegating, or working more.
The tracking loop:
Build system (invest hours)
Use the system (save hours)
Measure return (calculate ROI)
Build next system (compound returns)
Systems that show 3:1 ROI or better get expanded.
Systems below 3:1 get redesigned or eliminated.
This creates a self-optimizing system library.
Your measurement plan
Start a simple tracker this week.
Columns: System name, times used, hours saved.
Rhythm: Update it every Friday.
Watch how the hours compound.
The Four Hidden Problems That Make One-Build Systems Collapse
You’ve seen the framework work. Now here’s where it breaks.
These are the failure modes that destroy systematization even after you’ve built templates and started tracking.
1. Building one-build systems that don’t get used in real weeks
Spending hours building templates, then reverting to custom work because the template feels “not quite right” in the moment.
A consultant built 6 templates over 2 weeks and used 1 of them.
“The proposal template didn’t fit this client perfectly,” he said. “So I started from scratch.”
One exception became permission; after breaking his own system once, he stopped using any of them.
Templates don’t need to be perfect; they need to be 80% complete. The remaining 20% gets customized, but 80% should be reusable or the template isn’t saving meaningful time.
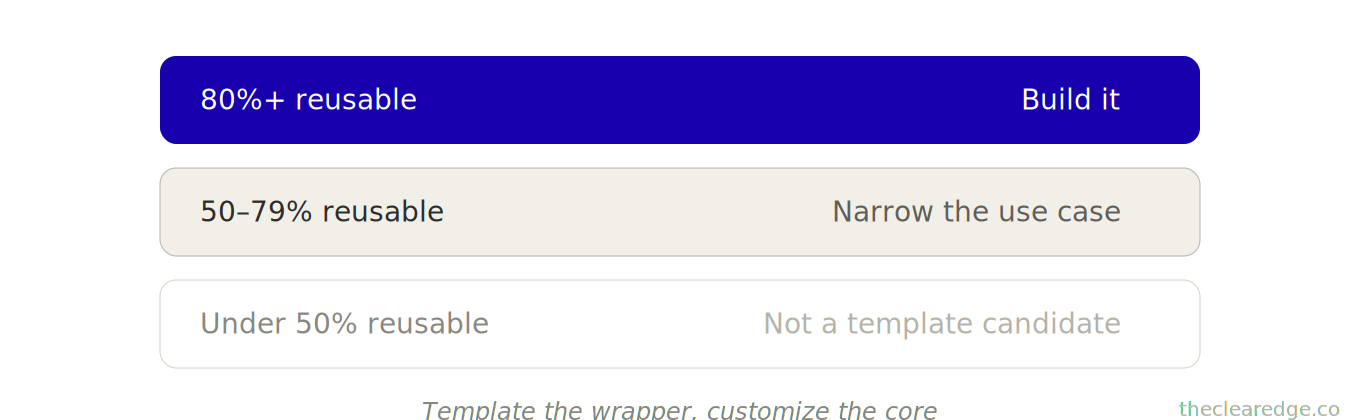
The fix: The 80/20 template test
Ask: “If I build this template, what percentage will be reusable across all uses?”
80%+ reusable → Build it
50–79% reusable → Narrow the use case
< 50% reusable → Not a template candidate
Example: Making a broad template actually useful
One agency owner wanted to template “client strategy documents.” Too broad; every strategy was different.
We narrowed to “e-commerce strategy documents for $2M–$10M brands,” which gave the template a clear lane.
Reusable (85%): market analysis, competitive research, framework application.
Client-specific (15%): brand details and specific tactics.
Now the template carries most of the work, and only the 15% layer changes.
2. Problem 2: Over-systematizing creative work instead of systematizing the wrapper
Not everything should be templated. Creative decisions, strategic thinking, and client-specific problem-solving need custom attention.
A coach tried to template her coaching calls by building a 30-question script and following it religiously, and clients hated it.
“It feels robotic,” one said. “Like you’re not actually listening to me.”
She systematized the wrong thing.
What to template: process, structure, documentation
What to keep custom: strategy, creative decisions, human connection
The distinction:
Template the wrapper (how you deliver), customize the core (what you deliver)
Template the questions (discovery framework), customize the insights (strategic recommendations)
Template the structure (report format), customize the content (analysis and recommendations)
One consultant’s successful split:
Templated: Discovery questions, project brief format, status update structure, reporting framework
Custom: Strategic analysis, specific recommendations, creative solutions, and client relationship
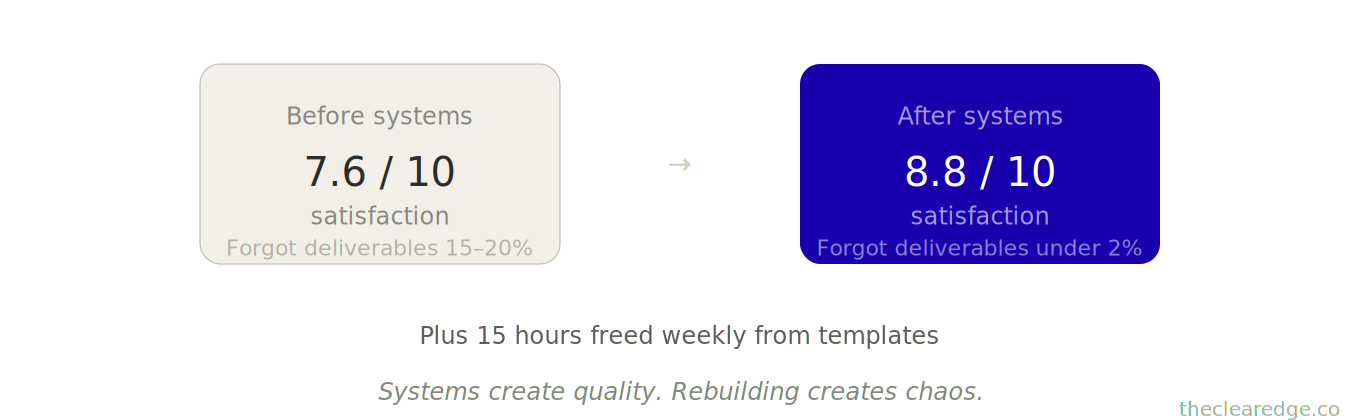
Client satisfaction: 8.9/10 (same as before templates, but 15 hours weekly freed for more custom work)
3. Not updating templates as you grow from $30K to $50K months
Templates built for $30K/month business don’t work at $50K/month because client needs change, service evolves, and better processes emerge.
Outdated templates become obstacles instead of assets.
An agency owner built a proposal template at $28K/month and was still using it at $52K/month; his close rate dropped from 41% to 29%.
The template was designed for $2,500 clients, but he was now selling to $6,500 clients with different objections, sophistication, and decision processes.
Wrong template for the current stage.
The fix: Quarterly template review
Ask each quarter:
Does this still align with our current delivery approach?
Are there new objections we need to address?
What’s changed in our service that should update the template?
Template refresh schedule:
Monthly: Quick updates (fix typos, update numbers)
Quarterly: Review relevance (does structure still work?)
Yearly: Complete rebuild (is this template still needed?)
4. Measuring hours saved but not quality maintained
Time savings mean nothing if quality drops and clients leave.
One consultant saved 18 hours weekly with templates but lost 3 clients in the next 60 days because templated communication felt impersonal and work quality declined.
Time saved: 18 hours weekly
Revenue lost: $10,500 monthly (3 clients × $3,500)
Net result: Negative (saved time, lost revenue)
Wrong trade.
The fix: Track two metrics, not one
Hours saved per system
Quality maintained (client satisfaction, retention, outcomes)
If templates save time but drop satisfaction below 8/10, they’re breaking the business.
Quality maintenance checklist for one-build systems at $30K–$50K
Client satisfaction stays 8+/10
Retention rate stays 85%+
Referral rate stays stable or improves
Outcome quality matches or exceeds pre-template baseline
One coach tracked:
Hours saved: 12 weekly (from templates)
Client satisfaction: 8.4/10 (same as before)
Retention: 91% (up from 87%)
Outcomes: Same or better (tracked via client progress metrics)
Result: Time saved without quality trade.
Systems protect quality by ensuring consistency. If quality drops, the system is poorly designed.
What Actually Changes With One-Build—and What It Costs to Ignore Systems
When you build once and reuse forever, three things shift:
1. Capacity becomes predictable
You stop guessing how many clients you can serve and start knowing exactly. With systemized delivery, time per client stays consistent and the math becomes reliable.
One consultant:
Templated delivery reduced client delivery from 8–14 hours (unpredictable) to 6–7 hours (consistent).
Capacity went from “maybe I can take 2 more clients” to “I can confidently serve 18 clients at current hours.”
Predictability enables growth planning.
2. Quality becomes consistent
Custom work quality varies based on energy, time pressure, and what you remember in the moment. Templated work embeds best practices so nothing gets forgotten.
One agency owner:
He used to forget key deliverables 15–20% of the time when rebuilding each project. With templates, he forgot them less than 2% of the time.
Client satisfaction: 7.6/10 → 8.8/10 from consistency alone.
3. Time compounds
Every system built pays returns forever. Early systems free up capacity to develop more systems. Returns accelerate.
One founder:
Month 1: Built 2 systems, saved 5 hours weekly
Month 3: Built 6 systems, saved 14 hours weekly
Month 6: Built 11 systems, saved 26 hours weekly
Month 12: Built 18 systems, saved 37 hours weekly
Total time saved: 37 hours weekly, 160 hours monthly, 1,924 hours yearly
At a $150/hour delivery rate: $288,600 yearly in capacity freed from systematization.
That’s nearly $300K in recovered time by building systems rather than rebuilding work.
The real cost of no one-build systems at $38K–$44K months
One consultant spent 18 months at $38K–$44K per month and couldn’t break through because he was always rebuilding.
His year, on paper:
Average weekly hours: 54
Average rebuild hours: 23
Average actual delivery hours: 31
If he’d systematized rebuild work:
Additional capacity: 20 hours weekly × 52 weeks → 1,040 hours yearly
At his proven $145/hour capacity rate, that’s $150,800 lost annually.
That’s the cost in his business: real revenue capacity that never turned into billable work because the systems to protect it didn’t exist.
Over 3 years at this pattern: $452,400 in lost capacity from continuously rebuilding instead of building once.
23 rebuild hours per week → 1,196 hours per year
1,196 hours per year → 29.9 workweeks annually spent recreating what should exist once.
Time compounds. Waste multiplies.

23 Weekly Rebuild Hours Into 30 Lost Workweeks
If you keep rebuilding delivery at 23 hours a week, you’re not running a business, you’re burning $150,800 in capacity every year; treat rebuild work as system debt and start clearing it now.
Run the One-Build Systems Litmus Test Checklist
Use this the moment you catch yourself rebuilding a proposal, report, onboarding, or check-in you’ve already created at least twice.
☐ Listed today’s repeat deliverable and tagged it as template, recording, or automation using your existing One-Build classifications
☐ Calculated today’s rebuild minutes for this deliverable and logged projected weekly hours saved if you used the built One-Build version instead
☐ Scored its Systems Leverage Ratio (hours saved ÷ hours invested) and marked anything at 3:1 or higher as mandatory for this pass
☐ Checked whether you’re templating wrapper or core and wrote which 80% runs from the asset and which 20% you’ll customize this time
☐ Logged any hit to satisfaction, retention, or outcomes so no One-Build asset keeps running if it risks pushing scores below 8/10
Every time you use this, you catch rebuild work before it quietly compounds into 18–29 weekly hours and $75K–$150K of lost capacity.
Where to Go From Here: Install One-Build and Stop Rebuilding $150K of Capacity
If you’re sitting in the $30K–$50K band and rebuilding the same delivery every week, you’re quietly donating $75K–$150K+ in capacity to work that should exist once and scale to 100 clients. That rebuild pattern is the drag that keeps you capped at 9–15 clients even when demand is already there.
From here, run the sequence once:
Identify your rebuild work with a two-week audit so you surface the 16–32 weekly hours that can be turned into systems and reclaimed as real delivery capacity.
Convert the highest-frequency repeats into One-Build assets (templates, recordings, automations) so proposals, reports, onboarding, and check-ins run in 25–15 minute passes instead of 2–4 hour rebuilds per client.
Track a simple Systems Leverage Ratio so you keep and expand the assets that return 10–80+ hours per build hour and phase out anything that doesn’t move your client count and revenue past the current ceiling.
The One-Build System becomes the permanent constraint killer that stops your capacity from leaking into rebuild work and lets revenue rise with clients instead of hours.
Your turn: What’s one thing you keep rebuilding that should already exist as a system?
What’s the one thing you’ve rebuilt 3+ times this month that you never want to create from scratch again?
Drop your answer below. I read every reply, and the patterns that show up often shape what I write next.
If you still can’t see what you’re rebuilding, just write “I need to track my week”—that awareness alone already puts you ahead of most founders.
Up Next: The Revenue Multiplier to Stack and Compound Your One-Build Systems
In “The Revenue Multiplier: Double Earnings Without Extra Hours for $50K–$65K Operators,” we break down how to layer systems that multiply each other’s returns instead of just adding them—for founders at $40K–$60K/month ready to scale capacity.
FAQ: One-Build System for Turning Repeat Work Into Scalable Delivery
Q: How does The One-Build System turn a $30K–$50K plateau into $48K–$56K without longer weeks?
A: It cuts rebuild hours from 23–29 per week down to 2–6 by turning proposals, onboarding, reports, and check-ins into reusable templates, recordings, and automations, which lifts client capacity from 9–15 to 18–22 and revenue from $33K–$42K to $48K–$56K+ without exceeding 50–56 hour weeks.
Q: Why does revenue keep capping around $36K–$42K even when I have 8–11 inbound leads waiting?
A: Because 18–29 hours weekly are trapped in rebuild work—like 100 monthly hours for onboarding, reports, calls, and proposals—leaving only 31–33 hours for real delivery and blocking you from taking the extra 4–11 clients that would add $44,000–$81,900 in monthly and annual capacity.
Q: How do I use The One-Build System with its three moves before I try to hire or work more?
A: Spend 2 weeks tracking what you rebuild, then convert the highest-frequency items into templates, recordings, and automations, and finally track a Systems Leverage Ratio so each system returns 10–80+ hours per hour invested and recovers $80K–$150K+ of annual capacity within 30–90 days.
Q: What happens if I keep rebuilding onboarding, proposals, and reports from scratch at $30K–$50K/month?
A: You’ll continue burning 18–29 rebuild hours every week—up to 1,196 hours or 29.9 workweeks a year—quietly losing $75K–$150K+ in capacity and staying stuck serving 9–15 clients at $36K–$42K instead of scaling to 18–22 clients and $48K–$56K.
Q: How do I run a 2-week rebuild audit to find the best One-Build candidates in my business?
A: For 7 days, log every deliverable with time spent and whether you’ve made it before, then in week 2 group identical or structurally similar items—like 19 process explanations, 13 reports, and 8 follow-ups—into template, recording, or automation candidates that can eliminate 31.35+ monthly hours of repeated work.
Q: When is work actually custom and when is it just a pattern that needs a template?
A: If 80%+ of the structure repeats across clients—like 12 of 15 projects using the same discovery, 14 of 15 sharing revision steps, or 15 of 15 following mockup → revision → final—you treat it as a One-Build candidate and only customize the last 10–20%.
Q: How do I template delivery so I keep 8.7–8.9/10 quality while freeing 18–29 hours weekly?
A: Turn repeat communication and structure into templates—such as 6-hour proposal builds into 25-minute customizations, 2.5-hour reports into 15-minute updates, and 45-minute check-ins into 10-minute prompts—then keep strategy, analysis, and human connection custom so satisfaction stays at or above 8.4–8.9/10.
Q: How do I measure the Systems Leverage Ratio so I know my One-Build assets are compounding?
A: Track hours invested, hours saved per use, and usage per month for each system—like a proposal template that costs 5 hours to build and saves 3.5 hours across 4 monthly uses (168 hours yearly, 33.6:1), or a 12-hour template sprint that returns 1,056 hours yearly (88:1) as you keep using the assets.
Q: What happens to my capacity and earnings over 12 months if I ignore One-Build and stay in rebuild mode?
A: At 23 rebuild hours per week and a proven $145/hour rate, you sacrifice about 1,040–1,196 hours yearly—roughly 26–29.9 workweeks and $150,800 in capacity each year, adding up to $452,400 in lost leverage if you stay in the $38K–$44K range for three years.
Q: What changes over the first 30–90 days when I fully implement The One-Build System?
A: Within 2 weeks you invest 10–12 hours in core systems, by Month 2 you’ve freed 18–21 hours weekly and added 3–4 clients, and by Month 3 founders routinely see rebuild hours drop from 23–29 to 2–6, weekly hours slide from 53–56 to about 51–52, and revenue climb from $33K–$42K to $48,400–$56,000 (+$12K–$20K).
Navigate The Clear Edge OS Systems for Scaling From $5K to $150K
Start here: The Complete Clear Edge OS — Your roadmap from $5K to $150K with a 60-second constraint diagnostic.
Use daily: The Clear Edge Daily OS — Daily checklists, actions, and habits for all 26 systems.
LAYER 1: SIGNAL (What to Optimize)
The Signal Grid • The Bottleneck Audit • The Five Numbers
LAYER 2: EXECUTION (How to Optimize)
The Momentum Formula • The One-Build System • The Revenue Multiplier • The Repeatable Sale • Delivery That Sells • The 3% Lever • The Offer Stack • The Next Ceiling
LAYER 3: CAPACITY (Who Optimizes)
The Delegation Map • The Quality Transfer • The 30-Hour Week • The Exit-Ready Business • The Designer Shift
LAYER 4: TIME (When to Optimize)
Focus That Pays • The Time Fence
LAYER 5: ENERGY (How to Sustain)
The Founder Fuel System • $100K Without Burnout
INTEGRATION & MASTERY
The Founder’s OS • The Quarterly Wealth Reset
AMPLIFICATION (AI & Automation)
The Automation Audit • The Automation Stack
⚑ Found a Mistake or Broken Flow?
Use this form to flag issues in articles (math, logic, clarity) or problems with the site (broken links, downloads, access). This helps me keep everything accurate and usable. Report a problem →
› More to Explore: Quick Navigation · The Clear Edge OS
➜ Help Another Founder, Earn a Free Month
If this system just saved you from wasting $75K–$150K+ a year on rebuild hours, share it with one founder who needs that relief.
When you refer 2 people using your personal link, you’ll automatically get 1 free month of premium as a thank‑you.
Get your personal referral link and see your progress here: Referrals
Get the One-Build System Toolkit to Turn Rebuild Hours Into Scalable Capacity
You’ve read the system. Now implement it.
Premium gives you:
Ready-to-use PDF toolkit—every template, diagnostic, and formula pre-filled, zero setup, immediate use
Plug-and-play AI diagnosis sessions—drop into Claude, Gemini or ChatGPT, answer a few questions, save hours of guessing, get your exact next move
Audio key points—concentrated frameworks you can absorb in minutes, implement while you move
Unrestricted access to the complete library—every system, every update
What this prevents: Wasting 1,196 hours a year rebuilding instead of reusing One-Build delivery systems.
What this costs: $12/month. The numbers that justify it are already in this article.
Download everything today. Implement this week. Cancel anytime, keep the downloads.
Already upgraded? Scroll down to download the PDF, audio, and your AI session.
