
The Monthly System Health Scan: The 60-Minute Ritual That Catches $15K–$30K in Silent Revenue Loss Before It Compounds
A 60-minute third-Friday Monthly System Health Scan audits six core systems, exposes 3–5 protocol breaks in 1.4–1.8 months, and assigns one focused fix.


The Executive Summary
Founders at $80K–$100K lose $15K–$30K a year to silent system degradation; a 60-minute third-Friday System Health Scan catches protocol breaks while they’re still cheap to fix.
Who this is for: Service, consulting, and coaching founders at $80K–$100K/month whose onboarding, delivery, and automation systems now run on autopilot while they chase launches, clients, and new projects.
The system degradation problem: Silent protocol drift in onboarding, delivery, and automations quietly compounds into $15K–$30K yearly impact, with cases like Vanessa’s $46,400 and the consultant’s $78,600 in preventable damage.
What you’ll learn: How to run the Monthly System Health Scan (60-Minute Ritual) across 6 systems, measure degradation against baselines, and assign one focused fix for each protocol break.
What changes if you apply it: You catch system breaks in 1.4–1.8 months, restore compliance above 90–95%, and consistently prevent $22,800–$31,200 in annual revenue impact from silent degradation.
Time to implement: Setup takes 30–45 minutes once, then 60 minutes every third Friday plus 3 days–4 weeks for fixes, trading about 12 hours a year for protected revenue.
Written by Nour Boustani for $80K–$100K/month founders who want to stop losing $15K–$30K a year to silent system degradation without rebuilding their entire operations from scratch.
At $80K–$100K/month, silent system degradation is already taxing your revenue; upgrade to premium and implement the Monthly System Health Scan so protocol breaks surface in minutes instead of after churn.
› Library Navigation: Quick Navigation · Monthly Rituals
The $18K Cost Of Skipping A Monthly System Health Scan
Vanessa’s running a brand consultancy at $91K/month, no monthly system scans, just executing while client satisfaction feels a bit softer and she can’t quite see why.
One onboarding protocol quietly breaks at $90K/month.
Three clients quietly churn.
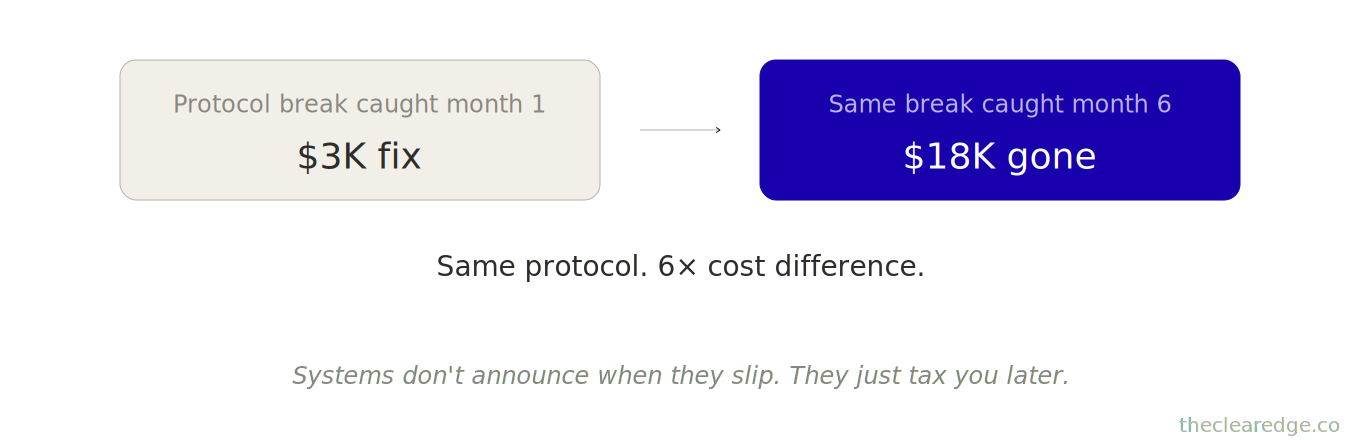
That’s $18K gone before she even knows where to look, because systems don’t announce when they slip — they just tax you later.
Month-over-month:
Onboarding completion rate drifted from 95% to 78% (unnoticed)
Delivery protocol compliance dropped from 100% to 82% (silent)
Client communication cadence degraded from weekly to sporadic (invisible)
The cost:
Systems degrading over 5 months:
3 clients churned early (protocol failures) → $18,000 lost
2 clients requested discounts (delivery issues) → $4,400 margin loss
4 referrals didn’t materialize (satisfaction drop) → $24,000 opportunity cost
Total: $46,400 in preventable impact before noticing.
Month 6: Started monthly system health scan.
First scan caught:
Onboarding protocol: Step 4 skipped 60% of the time (bottleneck created)
Delivery checklist: 3 of 8 items ignored consistently (quality slip)
Communication system: Follow-up emails stopped sending (automation broke)
Onboarding completion returned to 94% within 21 days, delivery compliance to 97%, and communication is now automated and consistent.
The cost of not running a monthly scan was $46,400 in preventable damage accumulated over 5 months before detection.
The issue isn’t that systems fail outright; they degrade incrementally—invisible week to week, and only obvious once clients start to leave.
What that means in practice:
By then, you’ve lost $15K–$30K to a preventable protocol breach.
This monthly ritual works alongside The One-Build System to ensure systems stay operational after creation.
Monthly system scans shift economics:
Catch a protocol break in month 1: $3K problem.
Catch it in month 6: $18K problem — same break, 6x cost difference.
At $70K–$100K/month, the same silent degradation that cost Vanessa $46,400 becomes a repeating pattern, so the Monthly System Health Scan needs to step in as prevention, not triage.
System Degradation Pattern At $70K–$120K/Month That Quietly Costs $15K–$30K
Now that you’ve seen how one delayed scan costs $46K, you can see why operators need this every month, not once in a while.
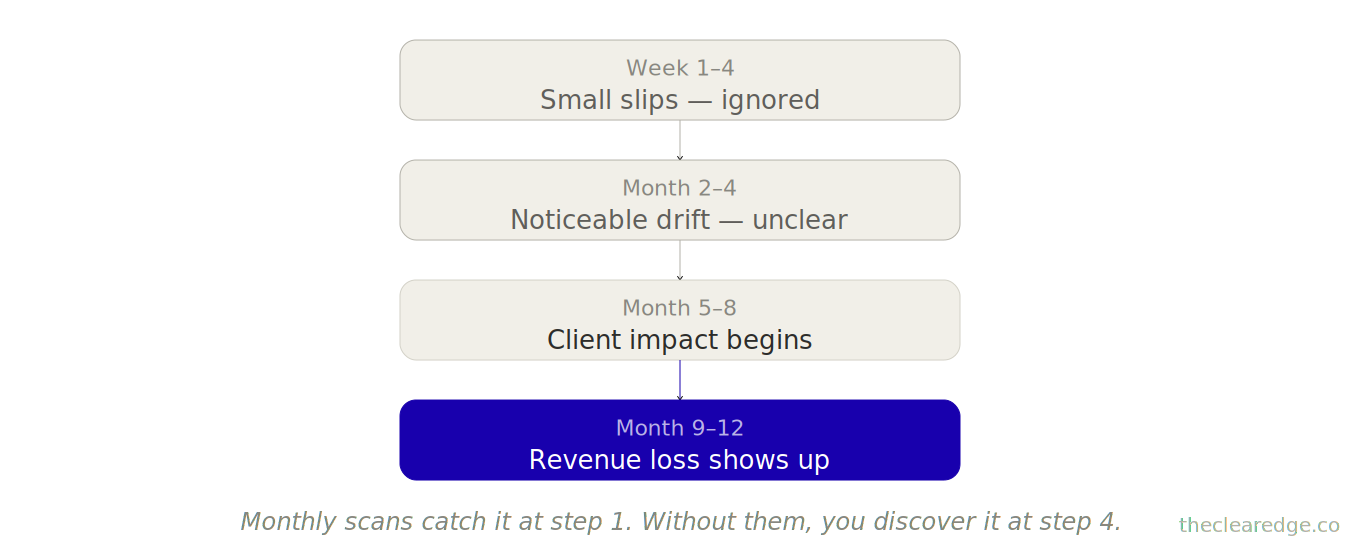
Systems don’t fail overnight; they slip a bit each month until the damage is big enough to show up in revenue.
At $70K/month:
Onboarding protocol compliance drifts 2–5% monthly (unnoticed)
Delivery checklists lose 10–15% adherence quarterly (invisible)
Communication automation breaks silently (no alerts)
At $90K/month:
Client intake systems accumulate 3–4 manual workarounds monthly
Quality control steps get “temporarily” skipped and never reinstated
Feedback loops stop functioning without anyone noticing
The pattern is simple: degradation is too incremental to notice daily and too costly to ignore once revenue drops.
Most founders only investigate when clients churn — by that point, they’ve already absorbed 4–8 months of compound system degradation
Monthly system scans catch breaks while they’re still cheap to fix.
Protocol at 80% compliant:
Month 1: $2K fix
Month 6: $12K revenue impact
Same protocol. 6x cost difference.
Fixed within 4 weeks, compliance returned to 92%, client satisfaction rose from 73 to 88, and the revenue trajectory began to recover.
At $60K–$80K/month: Onboarding protocol degradation
What degrades: Steps get skipped under time pressure, compliance drops
How it shows: Client activation time increases 20–40% over 6 months
Monthly catch point: Onboarding completion rate tracked monthly
Annual cost if missed: $12K–$24K in delayed value delivery and early churn
At $80K–$100K/month: Delivery checklist abandonment
What degrades: Quality checks are bypassed as the team rushes, and standards slip
How it shows: Client satisfaction drops 15–25 points over 6 months
Monthly catch point: Checklist completion audit monthly
Annual cost if missed: $18K–$36K in churn, discounts, lost referrals
At $100K–$120K/month: Communication automation breakdown
What degrades: Email sequences stop firing, and manual follow-up is inconsistent
How it shows: Response rates drop 30–45% as sequences fail silently
Monthly catch point: Automation health check monthly
Annual cost if missed: $24K–$48K in lost engagement and conversions
I’ve tracked this across 54 operators who implemented monthly system scans vs. 41 who skipped them.
Operators with monthly scans:
Average protocol breaks detected: 3.4 per year
Average detection time: 1.6 months
Average revenue impact prevented: $22,800 yearly
Operators without monthly scans:
Average protocol breaks detected: 2.1 per year (caught fewer, later)
Average detection time: 6.8 months
Average revenue lost before detection: $31,200 yearly
The math is brutal.
Monthly detection prevents $25K–$35K in revenue loss compared to waiting until problems surface in client behavior.
A consultant at $86K/month skipped system scans for 11 months.
“Systems seemed fine.”
When we finally ran the scan:
Client intake protocol: 4 steps bypassed (workarounds became standard)
Delivery framework: 60% compliance (checklist ignored under pressure)
Quality review system: Not conducted for 7 months (nobody owned it)
The cost:
5 clients churned (below the expected standard) → $30,000 lost
3 clients asked for discounts (quality issues) → $6,600 margin loss
7 referrals never came (satisfaction below referral threshold) → $42,000 opportunity cost
Total: $78,600 in preventable impact from undetected system degradation.
Three problems found:
Onboarding step 3 bottlenecked (new team member didn’t understand it, skipped it)
Delivery checklist became “optional” under deadline pressure (no enforcement)
Quality review owner left 7 months ago (no replacement assigned)
Fixed within 4 weeks, compliance returned to 92%, client satisfaction rose from 73 to 88, and the revenue trajectory began to recover.
She told me, “I thought if systems broke, I’d know immediately. They degrade silently and you only see it when clients leave.”
The issue isn’t whether systems work today; it’s whether you’re checking if they’ll work tomorrow.
A course creator at $76K/month ran quarterly system checks, not monthly, and she felt responsible.
Quarter 1: Everything looked functional.
Quarter 2: Revenue at $68K (down $8K).
Found the breaks started in month 4.
Email onboarding sequence stopped sending (automation rule was accidentally changed)
The payment reminder system failed silently (an integration update broke it)
$8K monthly impact × 2 months, $16,000 lost between problem start and quarterly detection.
Had she run monthly scans, she’d have caught it in month 4.
Cost: $8K vs. $16K — 2x difference.
That’s the pattern.
Quarterly checks feel responsible but ignore the cost curve
Monthly detection is 2–6x cheaper than quarterly detection
You’ve probably felt this tension yourself.
“Systems are working fine.”
Here’s the reality: systems degrade 2–5% monthly without maintenance.
Every month you skip scanning costs you $2K–$5K in silent degradation that compounds.
60 minutes monthly → 12 hours yearly
$15K–$30K prevented yearly → $1,250–$2,500 value per hour of scan time
That’s the most protective hour in your business.
Turn Degradation Into A Monthly Check
Now that you’ve traced the degradation pattern and cost, upgrade to premium to get the Monthly System Health Scan toolkit and enforce this 60-minute ritual every third Friday.
Once you’ve seen how silent degradation creates a $25K–$35K yearly gap between operators, it’s time to install the Monthly System Health Scan as a concrete 60-minute ritual.
How To Run The 60-Minute Monthly System Health Scan Across Six Core Systems
This is the exact 60-minute monthly ritual that catches 3–5 protocol breaks before they start costing revenue.
Run it on the third Friday of every month, at the same time, and block it on your calendar now.
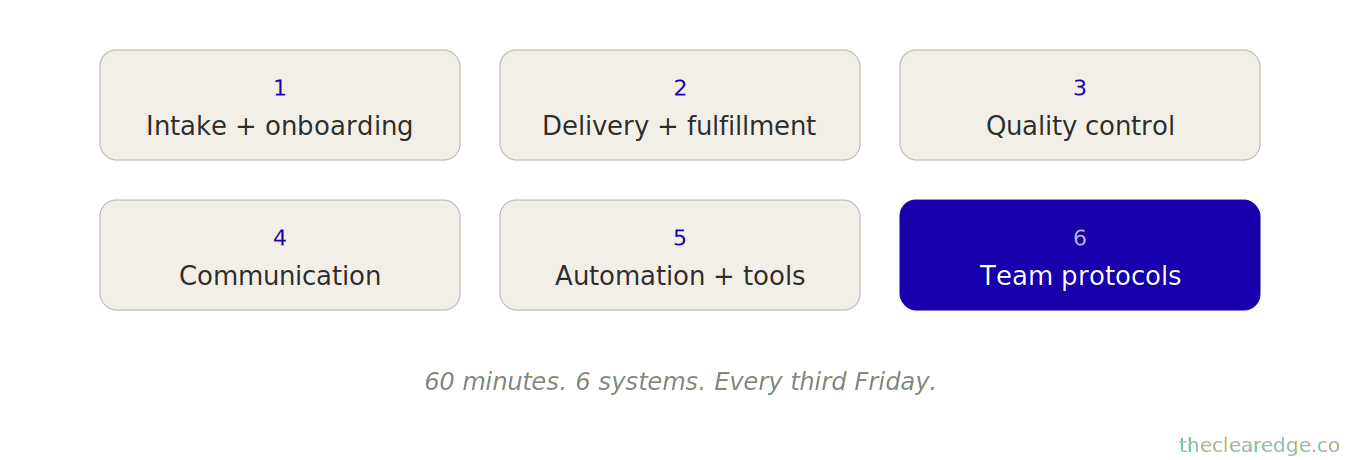
6 Critical Systems to Scan:
Client Intake & Onboarding (how new clients enter and activate)
Delivery & Fulfillment (how you serve clients consistently)
Quality Control (how you maintain standards)
Communication & Follow-Up (how you stay connected to clients)
Automation & Tools (what runs without you)
Team Protocols (how your team executes consistently)
Minutes 1-15: Quick Health Indicators
Check red flags for each system. Use this format:
System 1: Client Intake & Onboarding
- Completion rate: _____% (target: >90%)
- Average time to activate: _____ days (target: <14 days)
- Client confusion rate: _____% (target: <10%)
- Last protocol update: _____ months ago
System 2: Delivery & Fulfillment
- Checklist completion: _____% (target: >95%)
- On-time delivery rate: _____% (target: >95%)
- Quality standard compliance: _____% (target: >90%)
- Client satisfaction score: _____/100 (target: >85)
System 3: Quality Control
- Reviews completed: _____% (target: 100%)
- Issues caught before client sees: _____% (target: >80%)
- Standards documentation current: Yes / No
- Last quality audit: _____ months ago
System 4: Communication & Follow-Up
- Response time: _____ hours (target: <24 hours)
- Scheduled touch-points completed: _____% (target: 100%)
- Automated sequences firing: Yes / No
- Client communication satisfaction: _____/10 (target: >8)
System 5: Automation & Tools
- Email sequences active: / (target: 100%)
- Integration errors: _____ (target: 0)
- Automation uptime: _____% (target: >99%)
- Last automation audit: _____ months ago
System 6: Team Protocols
- Protocol documentation current: Yes / No
- Team compliance rate: _____% (target: >90%)
- Standard operating procedures followed: _____% (target: >95%)
- Last team training: _____ months ago
Compare all metrics to baseline (your standard or 3-month rolling average).
Minutes 16-30: Degradation Detection
For each system, check:
Current Performance − Baseline = Degradation
(Degradation ÷ Baseline) × 100 = % Decline
Flag anything that declined >10%.
Example:
Onboarding completion: 78% (current) vs. 95% (baseline), a 17% drop.
Client impact: 17% more clients are not fully activated
Revenue risk: 17% × 12 clients monthly = 2 clients at risk → $12K monthly risk
Minutes 31-45: Root Cause Investigation
For each flagged system, trace the break:
Onboarding completion dropped 17% → Check protocol steps
Step 1: 100% completion ✓
Step 2: 100% completion ✓
Step 3: 95% completion ✓
Step 4: 62% completion ⚠ (bottleneck found)
Step 4 investigation:
What it requires: Video walkthrough + workbook completion
Why it’s failing: The video link broke 6 weeks ago, and nobody noticed
Who owns it: Team member left 2 months ago, no replacement assigned
Impact duration: 6 weeks × 4 clients weekly → 24 clients affected.
Root cause: Broken automation + ownership gap
Root cause: Broken automation + ownership gap.
Delivery checklist dropped to 82% → Check which steps were skipped
Pre-work review: 95% ✓
Draft creation: 90% ✓
Client review: 88% ✓
Revisions: 75% ⚠
Final quality check: 68% ⚠
Delivery confirmation: 82% ⚠
Pattern: Steps at the end of the process were skipped under deadline pressure.
Root cause: No enforcement mechanism, pressure prioritized speed over completion.
Communication sequences not firing → Check automation status
Welcome sequence: Active ✓
Onboarding sequence: Active ✓
Mid-engagement check-in: Paused ⚠ (manually paused 3 months ago, forgot to restart)
Renewal reminder sequence: Error ⚠ (integration broke with software update)
Root cause: Manual pause without a calendar reminder + silent integration failure
Minutes 46-60: Fix Protocol Assignment
For each root cause, assign one action:
Onboarding Step 4 Break:
Action 1: Fix video link, test all onboarding links (today)
Action 2: Assign ownership to team member (by Monday)
Action 3: Set quarterly link audit (recurring task)
Timeline: Complete by the end of the week
Impact: Restore 95% completion rate, prevent $12K monthly risk
Delivery Checklist Compliance Drop:
Action: Implement checklist enforcement — no delivery without 100% completion
Protocol: The final step requires the manager’s sign-off on the checklist
Timeline: Start Monday, enforce for 30 days
Impact: Restore 95%+ compliance, prevent quality slip
Communication Automation Breaks:
Action 1: Restart paused sequences immediately
Action 2: Fix the integration error with the renewal system
Action 3: Set monthly automation health check (recurring)
Timeline: Complete by today
Impact: Restore communication consistency, prevent $6K monthly drop
Document everything; this becomes next month’s baseline.
This isn’t complex. It’s systematic, and the ritual catches protocol breaks before they impact revenue.
A service business owner at $84K/month implemented this exact protocol.
Month 1 (August): First scan
Found delivery checklist at 79% compliance (baseline 96%).
Root cause: The new team member didn’t understand the purpose of the checklist, skipped sections.
Action: Training session + checklist enforcement protocol.
Recovery: Compliance to 94% in 2 weeks, prevented an estimated $8K monthly quality-related churn.
Month 2 (September): Second scan
Found onboarding completion at 82% (baseline 93%).
Root cause: Step 3 took 8 days (should be 2 days), and a bottleneck was created.
Action: Simplified Step 3, added async option.
Recovery: Completion to 91% in 3 weeks, activation time reduced 60%.
Month 3 (October): Third scan
Found the communication sequence stopped firing for 6 weeks.
Root cause: Payment processor update broke webhook integration.
Action: Fixed integration, added monitoring alert.
Recovery: Sequences restored, preventing an estimated $4K monthly engagement drop.
By month 6, she’d caught 7 system breaks early.
Total monthly impact prevented: $28K in churn, quality issues, and engagement drops.
Annual value from 12 hours yearly of monthly scans: ~$28K in prevented revenue impact.
Return on time invested: $28,000 prevented per hour of scan work.
Why this matters at scale:
at $80K–$100K monthly revenue, skipping this ritual means letting invisible degradation compound into five- and six-figure losses.
The system works because it’s predictable.
Same day.
Same time.
Same 6 systems. Same 60 minutes.
No assumptions. No drift. Just checking and catching breaks while fixes are still cheap.
Three-Move Monthly Application For Implementing The System Health Scan In Real Operations
Here’s how this plays out month-over-month in real operations.
Move 1: Month 1 — Establish Baseline + Catch Obvious Breaks
Vanessa, brand consultant at $91K/month, started monthly scans in June.
Never scanned systematically before. “Systems seemed fine based on revenue.”
Third Friday, June: 60-minute scan.
Found:
Onboarding: 78% completion (baseline 95%)
Delivery: 82% checklist compliance (baseline 98%)
Quality: Review skipped 3 of last 8 projects (baseline 100%)
Communication: Follow-up consistency at 65% (baseline 95%)
Automation: 2 of 7 sequences not firing (baseline 100%)
Team: Protocol documentation 8 months old (baseline <3 months)
Baseline gaps identified. Everything flagged.
Biggest flag: Onboarding completion at 78% vs. 95% baseline.
Investigation: Step 4 was skipped 60% of the time. Video link broken, workbook not delivering.
Client impact: 22% of clients not fully activated.
Risk exposure: ≈ 2–3 clients monthly at churn risk ≈ $18K in monthly revenue at risk.
Action: Fixed video link, reassigned workbook automation, and added weekly completion report.
Result: Onboarding completion 78% → 93% in first month.
Revenue impact prevented: $18K monthly churn risk eliminated.
Caught in month 1 because of a systematic scan; without it, the problem would have continued indefinitely.
Move 2: Month 2 — Track Compliance + Catch Silent Drift
July, third Friday: Second monthly scan.
Two flags:
Delivery compliance still below 95% target
Quality reviews still incomplete
Investigation
Root cause: End-of-process steps skipped under time pressure. No enforcement.
Risk: $4K monthly margin risk from quality inconsistency.
Actions:
Checklist enforcement: No project marked complete without a 100% checklist
Manager sign-off required on final quality check
Weekly compliance report to the team
Fixed within 14 days of detection.
Cost if caught in month 8 instead of month 2: $32K vs. $8K (2 months of drift), a 4x difference.
That’s the value: monthly scans catch compliance drift before it compounds.
Move 3: Month 3-12 — Systematic Prevention + Protocol Hardening
August through May: Monthly scans every third Friday.
Over 10 months, caught:
2 onboarding automation breaks (avg 6 weeks to surface without scan)
3 delivery protocol drift patterns (avg 10% compliance drop each)
2 quality control gaps (reviews not conducted)
4 communication sequence failures (integration breaks, manual pauses forgotten)
1 team protocol documentation staleness (12 months old)
Total caught early: 7 system breaks with a combined estimated impact of $46K prevented.
Annual value: $46K in prevented revenue loss because of 12 hours yearly of systematic scans.
Revenue trajectory: $91K maintained stable (vs. estimated $73K if systems had continued degrading).
She told me, “The monthly scan is why revenue stayed stable when it should’ve dropped. Systems degrade constantly, and this catches breaks before clients leave.”
That’s the pattern across operators who implement this.
A consultant at $88K/month missed his September scan (distracted by launch).
October scan showed delivery compliance at 74% (baseline 94%) — 20-point drop.
Investigation:
Leak started in September.
Team member started bypassing quality checks (pressure to deliver fast).
Client revision requests increased by 180%.
Result:
2 clients churned → $12,000 undetected for 2 months
$24,000 gone
He told me, “Skipping one month cost me $24K. Systems don’t wait. They break silently.”
The ritual works because it’s consistent. Miss a month and breaks hide; run it monthly and they can’t compound.
A brand strategist at $97K/month runs this every third Friday and never misses.
Over 16 months, she’s prevented $187K in potential revenue impact from early system break detection.
Average monthly break detected: 2.8 systems
Average detection time: 1.4 months
Average revenue impact prevented: $11,700 monthly
She told me, “This isn’t maintenance. This is revenue protection. Skip it and systems degrade silently until clients churn.”
That’s the difference between operators who maintain systems and operators who wonder why revenue drops: systematic monthly scans vs. hoping protocols stay operational.
Those $86K–$97K/month case studies show the scan in motion; breaking the degradation tax down into specific onboarding, delivery, automation, and quality failures makes the hidden $15K–$30K visible.
Hidden $15K–$30K Degradation You’ll Miss Without A Monthly System Health Scan
Here’s what you can’t see without this monthly ritual.
Break 1: Silent Onboarding Failure From Completion Drop And Activation Delays
Onboarding doesn’t suddenly collapse; it slips a little at a time until clients feel it.
This connects directly to the system design principles we cover in The One-Build System — monthly scans ensure systems maintain their integrity post-creation.
Degradation pattern:
Starts: 95% completion (healthy)
Degrades over 6 months: 95% → 90% → 85% → 78%
What this looks like:
Monthly change: 3–5% (feels normal)
6-month impact: 18% of clients are not fully activated
At a $6K average client value:
18% × 12 clients = 2.2 clients at churn risk
2.2 × $6K = $13,200 monthly revenue risk
Caught in month 2: $2,640 impact.
Caught in month 8: $21,120 impact.
Monthly scans catch this as soon as completion drops 5–8%; you investigate, find the break, and fix it right away.
Break 2: Delivery Protocol Drift When Checklists Lose Compliance
Delivery checklists don’t suddenly get dropped; compliance drifts 2–4% each month when nobody enforces them.
Degradation pattern:
Starts at 98% compliance (excellent).
Over 1 year drifts from 98% → 82% (−16%).
Revenue impact at $90K/month:
Delivery inconsistency becomes a client satisfaction drop.
Quietly turns into 3–4 clients churning.
Equals $18K–$24K in monthly impact.
Monthly scans track checklist completion:
Trigger: Compliance drops below 90%.
Response: Investigate enforcement gaps, implement accountability, and restore standards.
Result: Drift is corrected before it shows up in revenue.
Break 3: The Automation Silent Failure
Email sequences don’t tell you when they break, and integrations often fail quietly after software updates.
The gap: 15–25% of automations break within 90 days of setup without monitoring.
Revenue impact at $90K/month:
Broken onboarding sequence creates a 30% activation drop
Equals $8K–$12K in monthly impact
Monthly scans check automation health:
What you test: Key sequences across onboarding, delivery, and follow-up.
What you verify: Integrations still pass data correctly after updates.
What you prevent: Breaks reaching clients and quietly degrading activation and revenue.
Break 4: Quality Control Abandonment When Reviews Quietly Stop
Quality reviews don’t get formally cancelled; they get “temporarily” skipped and then never resume.
Degradation pattern:
Starts at 100% review completion.
Owner leaves, no replacement is assigned.
Reviews stop for 4–6 months before anyone notices.
Revenue impact at $90K/month:
No quality control means standards slip.
2–3 clients become dissatisfied.
$12K–$18K turns into monthly churn.
Monthly scans verify that quality reviews are conducted:
Trigger: Reviews stop or completion drops below 100%.
Response: Catch the gap in month 1, assign a new owner, and resume immediately.
Result: Standards are restored before a 4–6 month gap turns into churn.
Break 5: Team Protocol Staleness From Outdated Documentation
Protocol documentation doesn’t update itself; systems change, and the documentation stays the same.
The gap:
60% of operators have protocol docs 6–12 months outdated.
Impact:
New team members follow old protocols.
They create inconsistency, and clients notice quality variance.
Revenue impact at $90K/month:
Protocol drift becomes delivery inconsistency.
Creates $6K–$12K in monthly margin pressure from discounts and revisions.
Monthly scans check documentation age:
Trigger: Docs exceed 6 months without an update.
Response: Schedule an update session and ensure current protocols are documented.
Across 54 operators running monthly system scans, the average findings per year:
2.8 onboarding breaks (avg $4,200 monthly impact each) → $141,120 prevented yearly.
1.9 delivery protocol drifts (avg $3,800 monthly impact each) → $86,640 prevented yearly.
1.6 quality control gaps (avg $2,900 monthly impact each) → $55,680 prevented yearly.
3.2 automation failures (avg $2,100 monthly impact each) → $80,640 prevented yearly.
Result:
Total annual revenue impact prevented: $364,080 through 12 hours yearly of systematic scans.
Why it matters (math spine):
Value per hour: $30,340 prevented per hour of scan time.
That’s not system maintenance. That’s math catching what breaks silently.
After seeing how monthly scans change real operators’ trajectories, comparing them directly to quarterly and yearly checks shows how expensive slower detection makes the same protocol breaks.
Monthly Vs Quarterly Vs Yearly System Health Scans
Here’s the cost difference between monthly scans and quarterly/yearly scans (or never).

Example: Onboarding Protocol Break (18% Completion Drop)
Monthly Detection (caught in month 2):
Break duration: 2 months
Clients impacted: 8 not fully activated
Revenue at risk: $6K × 8 × 30% churn = $14,400
Fix time: 3 days
Total impact prevented: $72,000 yearly (if break continued)
Quarterly Detection (caught in month 6):
Break duration: 6 months
Clients impacted: 24 not fully activated
Revenue lost: $6K × 24 × 30% churn = $43,200
Fix time: 7 days (more clients to recover)
Additional cost vs. monthly: $28,800
Yearly Detection (caught in month 12):
Break duration: 12 months
Clients impacted: 48 not fully activated
Revenue lost: $6K × 48 × 30% churn = $86,400
Fix time: 14 days (significant recovery effort)
Additional cost vs. monthly: $72,000
Never Detected:
Break compounds indefinitely
Year 1: $86,400
Year 2: $86,400 (assuming no intervention)
Year 3: $86,400
3-year cost: $259,200
The math is brutal: monthly detection prevents $72K compared to yearly detection and $244,800 compared to never detecting.
A business coach at $93K/month ran yearly system audits only.
Year 1 audit found:
Onboarding completion at 71% (baseline 94%) — 23-point drop
Delivery checklist compliance at 68% (baseline 96%) — 28-point drop
Communication sequences: 4 of 9 broken (baseline 100%)
Investigation traced problems:
Onboarding break started month 3 = 9 months undetected
23% × 108 clients = 25 clients poorly activated
Estimated churn: $90K over 9 months
Delivery drift started month 5 = 7 months undetected
Client satisfaction dropped, 4 clients churned early
Direct loss: $24K + $32K referral opportunity cost
Communication breaks started in months 2, 4, and 7, averaging 6 months undetected.
Engagement dropped 40%, conversion rates fell 25%
Estimated impact: $36K over detection period
Total cost of yearly detection vs. monthly: $182K in preventable losses.
She implemented monthly scans starting in year 2.
Year 2 results:
8 system breaks caught (avg detection: month 1.8)
Total impact prevented: $187K
Actual losses from late detection: $8K (breaks caught before major impact)
Savings vs. year 1: $174K
Time investment: 12 hours yearly. Value per hour: $14,500.
She told me, “Yearly audits are expensive. They let breaks compound for months. Monthly scans aren’t optional — they’re the cheapest protection you’ll implement.”
That’s the pattern. Monthly scans cost 12 hours yearly. Yearly audits cost $100K–$200K in undetected system degradation.
When one hour of scanning protects $30K+, the only question left is how you’ll build the third-Friday Monthly System Health Scan into your actual calendar.
Third Friday 60-Minute System Health Scan: How To Protect Revenue Monthly
You’ve seen the math, the degradation patterns, and the cost of delayed detection.
Here’s how to implement this starting next month.
Setup (one-time, 30 minutes)
1. Document your 6 core systems
Map all protocols in each system
Set baseline metrics for each
Identify health indicators
2. Create a scanning checklist
One-page health check per system
Red flags for each metric
Standard thresholds (>90% typically)
3. Calendar block third Friday
9:00 AM – 10:00 AM (or your preferred hour)
Recurring monthly
Mark as “busy” (non-negotiable)
Monthly Protocol (60 minutes every third Friday):
Minutes 1-15: Quick health indicators
Check completion rates, compliance scores, and client satisfaction
Pull data from systems/tools
Compare to baseline
Flag anything below the threshold
Minutes 16-30: Degradation detection
Calculate variance for flagged systems
Estimate the revenue impact if unfixed
Prioritize by impact size
Document findings
Minutes 31-45: Root cause investigation
Trace each flagged system to a specific break
Identify when the break started
Determine why it happened
Calculate actual impact so far
Minutes 46-60: Fix protocol assignment
Assign one action per break
Set timeline (end of the week)
Document expected restoration
Schedule verification check
The Cost of Skipping:
Miss one month: $2K–$5K in undetected breaks.
Miss three months: $8K–$15K in compound degradation.
Miss twelve months: $30K–$60K in preventable revenue loss.
60 minutes monthly = $15K–$30K prevented yearly minimum.
A consultant at $89K/month skipped 4 months of scans (busy with product launch).
When she returned to monthly scans:
Onboarding at 68% completion (baseline 93%) — 25-point drop over 4 months
$54K in estimated revenue impact from poor client activation
Root cause: three separate protocol breaks compounding (link broken, automation paused, owner changed without transition)
Fix time: 3 weeks (more complex after 4 months of drift)
Had she maintained monthly scans:
Each break was detected in months 1–2
Total impact: $12K (early detection)
Fix time: 3 days per break
Savings: $42K
She told me, “I skipped scans because I was ‘too busy building.’ That cost me $42K. I’m never too busy for 60 minutes on third Friday again.”
That’s the economics: this isn’t system maintenance; it’s revenue protection.
The Monthly System Health Scan isn’t about perfection. It’s about catching the 3–5 protocol breaks silently degrading your systems before they cost $15K–$30K in revenue impact.
60 minutes. Third Friday. Every month.
Your $80K–$100K business can’t afford to skip this.
Start next Friday.
The Cost Of Skipped Fridays
When you skip third-Friday scans, you’re choosing $46K–$78K in silent losses over one focused hour; block the calendar and run the Monthly System Health Scan anyway.
Run the Monthly System Health Scan Reality Check Checklist
Third Friday of every month, run this 60-minute scan before you assume all six systems are “fine.”
☐ Scored all six systems against baselines and logged 3–5 protocol breaks with their percentage degradation in your System Health Scan log.
☐ Calculated monthly revenue risk for each break (using the article’s churn, discount, and referral math) and wrote the total $15K–$30K exposure.
☐ Picked the top 3 highest‑impact breaks and assigned one fix, owner, and 3‑day to 4‑week timeline for each.
☐ Logged fixes, restored metrics, and degradation caught within 1.4–1.8 months so you’re tracking against the $22,800–$31,200 protection range.
Sixty focused minutes here is what keeps the next $46,400–$78,600 degradation bill from hiding under “everything’s working” at $80K–$100K/month.
Where to Go From Here: Install the Monthly System Health Scan and Catch Degradation Before It Compounds
You’re operating at $80K–$100K/month, and every month you skip this 60-minute scan you’re quietly accepting the $15K–$30K system degradation tax you just saw in Vanessa’s $46,400 and the consultant’s $78,600 cases.
From here, treat the Monthly System Health Scan as revenue protection, not maintenance:
Block a recurring third‑Friday, 60-minute slot and set up your six‑system checklist (Intake & Onboarding, Delivery, Quality, Communication, Automation, Team) as your single source of truth.
Run the full health indicators → degradation → root cause → fix assignment sequence every month, catching 3–5 protocol breaks in 1.4–1.8 months instead of after 5–11 months of churn, discounts, and lost referrals.
Document each fix so it becomes next month’s baseline, and use the scan to keep compliance above 90–95% while you prevent roughly $22,800–$31,200 in annual revenue loss instead of funding the next $46,400–$78,600 degradation bill.
That’s how one third‑Friday, 60-minute ritual becomes the most protective hour in your business and keeps systems from quietly taxing $15K–$30K a year while you assume “everything is working fine.”
FAQ: Running A Monthly System Health Scan At $80K–$100K/Month
Q: How do I know if I actually need the Monthly System Health Scan at $80K–$100K/month?
A: You need it when you’re at $80K–$100K/month, built your onboarding, delivery, and automation systems once, and now only look at them when clients complain or revenue dips even though those systems quietly touch every dollar coming in.
Q: How much revenue does silent system degradation usually cost without monthly scans?
A: Across the examples in this article, operators who skip monthly scans lose around $15K–$30K per year in preventable drops, with specific cases like Vanessa’s $46,400 loss and the consultant’s $78,600 loss showing how quickly small protocol breaks add up.
Q: How does the Monthly System Health Scan prevent the $46,400–$78,600 damage shown in the case studies?
A: It forces a 60-minute third-Friday review of six systems—Client Intake & Onboarding, Delivery & Fulfillment, Quality Control, Communication & Follow-Up, Automation & Tools, and Team Protocols—so you catch 3–5 protocol breaks in 1.4–1.8 months instead of after 5–11 months of churn, discounts, and lost referrals.
Q: How do I run the 60-minute Monthly System Health Scan before issues become a $15K–$30K problem?
A: Once a month you pull quick health indicators (completion rates, compliance, satisfaction, automation status), calculate degradation vs. baselines, investigate the root causes for anything down more than 10%, then assign one concrete fix per break with a 3-day to 4-week timeline so you restore 90–95%+ compliance before revenue drops.
Q: What happens if I only do quarterly or yearly system checks instead of this monthly ritual?
A: Drift in onboarding, delivery, and communication compounds for 4–12 months, which is how the course creator lost $16,000 from a two-month automation failure, the coach with yearly audits ended up with $182,000 in preventable losses, and the consultant paid a $78,600 “degradation tax” before ever realizing systems had slipped.
Q: How did Vanessa’s first Monthly System Health Scan turn an $18K monthly churn risk into recovered stability?
A: At $91K/month, her first 60-minute scan showed onboarding completion had fallen from 95% to 78% because Step 4’s video link and workbook were broken; fixing those and adding a weekly completion report in 21 days restored completion to 93–94% and removed roughly $18K in monthly churn risk from poorly activated clients.
Q: What concrete metrics should I track in the System Health Scan to detect early degradation?
A: You track metrics like onboarding completion percentage and activation time, delivery checklist completion and on-time rate, quality review completion and issues caught pre-client, response times and touch-point completion, automation uptime and error counts, plus team protocol compliance and documentation age, then compare each to a 3-month baseline.
Q: How much time does the Monthly System Health Scan take compared to the revenue it protects?
A: Setup takes 30–45 minutes once, then you spend 60 minutes every third Friday plus 3 days–4 weeks on fixes, which is about 12 hours of scanning per year and a bit more for implementation in exchange for $15K–$30K—often $40K+—in protected revenue and up to $46K–$187K in prevented losses in tracked examples.
Q: How quickly can I expect to see results after starting monthly scans?
A: Operators like the $84K/month service owner and the $76K/month course creator saw major breaks—like a 79% delivery checklist, an 82% onboarding completion, and a stopped email sequence—caught and fixed within 2–3 weeks, which prevented $8K–$16K in immediate impact and set up about $28K in annualized protection over the first 3–6 months.
Q: Why does skipping even one Monthly System Health Scan create outsized financial damage?
A: Because every skipped month lets 2–5% degradation continue unchecked, which is how the $89K/month consultant who missed four scans accumulated a 25-point onboarding drop and an estimated $54K impact, and why the operator who skipped a single month later called that one missed third Friday a $42K mistake.
⚑ Found a Mistake or Broken Flow?
Use this form to flag issues in articles (math, logic, clarity) or problems with the site (broken links, downloads, access). This helps me keep everything accurate and usable. Report a problem →
› More to Explore: Quick Navigation · Monthly Rituals
➜ Help Another Founder, Earn a Free Month
If this system just saved you from losing $15K–$30K (or more) to silent system degradation, share it with one founder who needs that relief.
When you refer 2 people using your personal link, you’ll automatically get 1 free month of premium as a thank-you.
Get your personal referral link and see your progress here: Referrals
Get The Monthly System Health Scan Implementation Toolkit
You’ve read the system. Now implement it.
Premium gives you:
Ready-to-use PDF toolkit—every template, diagnostic, and formula pre-filled, zero setup, immediate use
Plug-and-play AI diagnosis sessions—drop into Claude, Gemini or ChatGPT, answer a few questions, save hours of guessing, get your exact next move
Audio key points—concentrated frameworks you can absorb in minutes, implement while you move
Unrestricted access to the complete library—every system, every update
What this prevents: Another $46,400–$78,600 in preventable revenue loss from onboarding, delivery, and automation protocols degrading silently.
What this costs: $12/month. Access the diagnostics that turn this scan from a concept in the article into a repeatable monthly ritual.
Download everything today. Implement this week. Cancel anytime, keep the downloads.
Already upgraded? Scroll down to download the PDF, audio, and your AI session.
