
The Monthly Strategic Shift: The 60-Minute Ritual That Prevents $30K–$60K in Panic Pivots Every Year
The Monthly Strategic Shift is a 60‑minute, fourth‑Friday Market Response Protocol that tracks 5 signals and routes them through a Monitor/Test/Integrate/Pivot ladder.


The Executive Summary
Founders at $100K–$130K risk $30K–$60K in panic pivot costs by reacting quarterly instead of monthly; a 60-minute fourth-Friday review catches scattered signals early enough to turn them into calm, incremental shifts.
Who this is for: Agency, consulting, and course founders at $100K–$130K/month who execute hard, don’t track market signals monthly, and keep getting cornered into sudden, disruptive pivots.
The strategic shift problem: Monthly signals quietly stack into a single $81K panic pivot, with operators routinely eating $30K–$60K in wrong turns, margin erosion, and 6–12 months of late reactions.
What you’ll learn: How to run the Monthly Strategic Shift (60-Minute Ritual), track five signals, and route them through the Monitor / Test / Integrate / Pivot ladder tied to clear percentage thresholds.
What changes if you apply it: Instead of rebuilding after a $53K–$81K pivot shock, you catch 3–5 signals a year in the 15–40% range and spend $6K–$12K per adaptation to lift from $118K toward $127K–$135K without disruption.
Time to implement: Setup takes 30 minutes once, then 60 minutes on the fourth Friday each month plus 30–90 day micro-adaptations, trading about 12 hours a year and $20K–$25K in planned investments to avoid $75K–$85K in pivot costs.
Written by Nour Boustani for $100K–$130K/month founders who want to adapt to market shifts through calm, monthly strategic moves instead of paying $30K–$60K for each reactive pivot.
Quarterly reactions keep turning normal drift into $30K–$60K panic pivots. Build the Monthly Strategic Shift into your cadence—upgrade to premium and de-risk your next moves.
› Library Navigation: Quick Navigation · Monthly Rituals
The $37K Panic Pivot Cost of Skipping Monthly Strategic Reviews
Omar is a marketing agency owner at $118K/month, executing hard with no monthly strategic reviews.
The market is already drifting toward video, but his model is built on written content, so he doesn’t see the shift until clients start asking for video services he can’t deliver.
By then, at $120K/month, a reactive pivot means three months of rebuilding and $37K in opportunity cost.
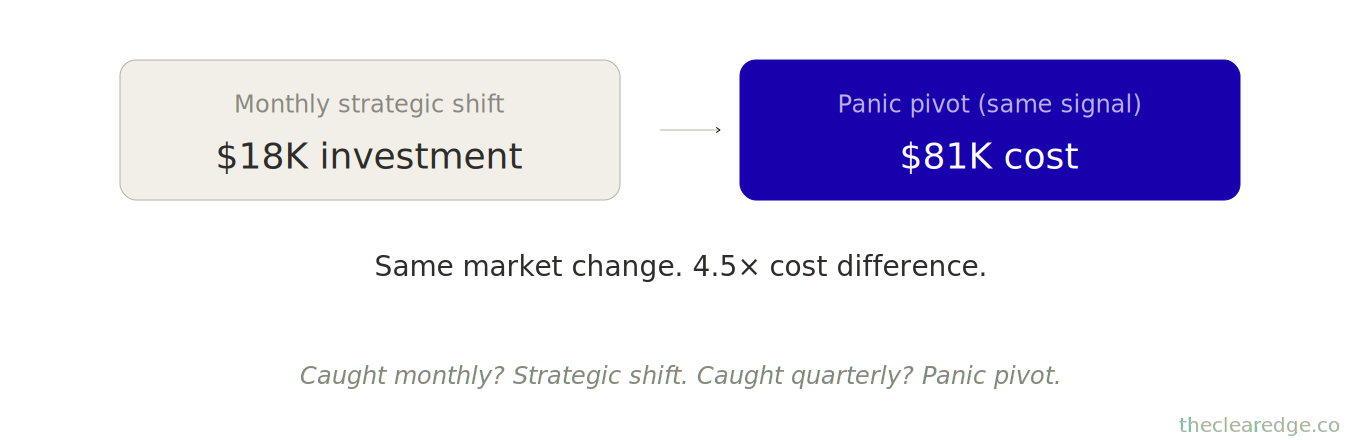
Caught monthly, that same pattern becomes a strategic shift; caught quarterly, it turns into a panic pivot.
This is what “I’ll deal with it next quarter” actually costs in real numbers.
Month-over-month (untracked):
Client requests for video increased from 2 to 8 monthly (unnoticed pattern)
Close rate on new business dropped from 65% to 48% (market expectation shifting)
Competitor positioning evolved toward video-first (missed opportunity to adapt early)
The cost:
By month 5, revenue pressure is visible:
Lost 4 deals to video-first competitors → $28K monthly opportunity cost
2 existing clients exploring other agencies → $14K monthly retention risk
Pricing pressure on written content (commoditized) → $6K monthly margin erosion
Total monthly impact: $48K before deciding to respond.
Panic pivot decision: “We’re now a video agency.”
Pivot cost:
3 months of learning video production → $36K in reduced capacity
Team training and hiring → $22K investment
Lost positioning credibility → $15K in deals lost during transition
Client confusion from sudden shift → $8K in churn
Total panic pivot cost: $81K over 6 months.
Month 7: Started the monthly strategic shift framework.
First monthly review caught:
Market trend: Video requests up 40% quarter-over-quarter
Competitive gap: 3 competitors added video services in 60 days
Client feedback: 6 of 12 clients asking about video capabilities
Strategic opportunity: Add video as a complementary service (not a replacement)
Response: Strategic shift (not panic pivot).
Month 8-11 adaptation:
Hired 1 video specialist (augmented existing team, didn’t replace)
Partnered with a video production studio (avoided full rebuild)
Positioned as “integrated content” (written + video), not “video agency.”
Maintained existing client relationships while adding capability
Result over 4 months: revenue moves from $118K to $127K (+7.6% growth) through adaptive shifts, not disruptive pivots.
Cost of monthly adaptation vs. a panic pivot: $18K in planned investment instead of an $81K pivot bill—a 4.5x cost difference.
The issue isn’t that markets change
The real problem is that you’re not tracking changes monthly to adapt incrementally.
By the time you pivot, you’ve already lost $30K–$60K to reactive decisions.
This monthly ritual works alongside The Bottleneck Audit to identify when market shifts create new constraints that require a strategic response.
Monthly strategic shifts prevent panic pivots.
Track changes monthly and you adapt incrementally.
Track changes yearly and you end up in a panic pivot.
How Market Shift Patterns Create $30K–$60K Panic Pivots Without Monthly Tracking
Now that you’ve seen how one panic pivot costs $81K, here’s why every operator needs monthly strategic adaptation.
Markets don’t stay static; they evolve continuously.
At $100K/month:
Client requests shift 3–5% monthly (new features, different deliverables)
Competitive positioning evolves 2–4% monthly (new services, pricing changes)
Channel effectiveness changes 5–10% quarterly (platform algorithm shifts)
At $120K/month:
Market expectations drift 10–15% annually (yesterday’s premium becomes today’s standard)
Technology capabilities expand 20–30% yearly (new tools enable new services)
Client sophistication increases 15–20% annually (they expect more, pay the same)
The pattern: change too incremental to notice weekly, too significant to ignore when revenue drops.
Most founders only adapt once revenue starts to fall—by that point, they’ve already lost 6–12 months of incremental positioning opportunity.
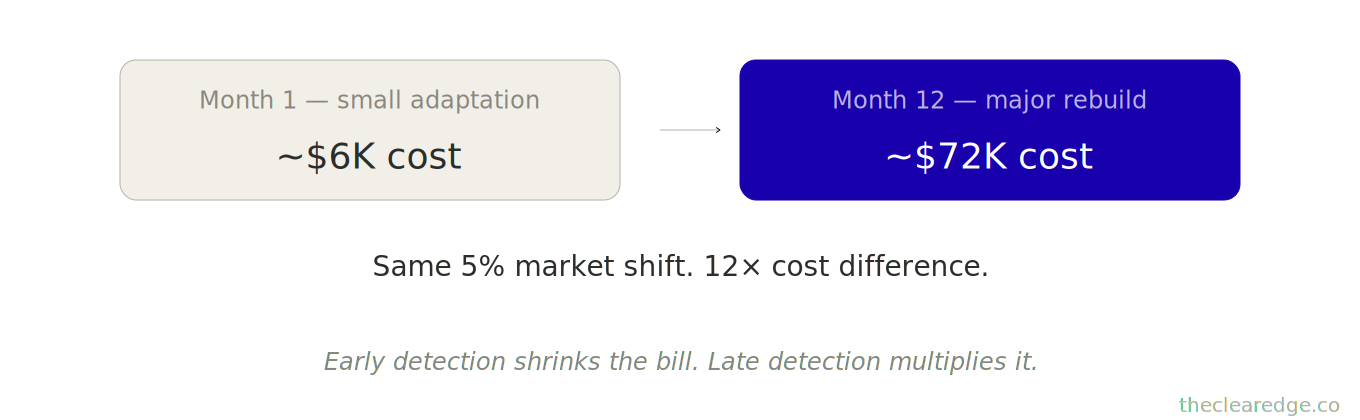
Monthly strategic shifts catch that drift while adaptation is still cheap. For a 5% market shift:
Month 1: $6K investment to add capability.
Month 12: $72K lost to competitive disadvantage. Same shift, 12x cost difference.
At $90K–$110K/Month: How Client Request Pattern Shifts Signal Strategic Adaptation
What shifts: 20% of client requests become “can you also do X?”
How it shows: Close rates drop 10–15% as competitors add capabilities
Monthly catch point: Track request types monthly, spot patterns at 15–20% threshold
Annual cost if missed: $18K–$36K in lost deals to more capable competitors
At $110K–$130K/Month: Competitive Positioning Evolution You Must Track Monthly
What shifts: 2–3 competitors reposition with new service bundles
How it shows: Pricing pressure increases, differentiation erodes
Monthly catch point: Competitive scan monthly, catch positioning shifts early
Annual cost if missed: $24K–$48K in margin erosion and lost premium positioning
At $130K–$150K/Month: Channel Effectiveness Degradation and When to React
What shifts: Primary acquisition channel ROI drops 20–30% as market saturates
How it shows: CAC increases, conversion rates drop, volume decreases
Monthly catch point: Channel performance tracked monthly, diversification triggered at 15% ROI drop
Annual cost if missed: $36K–$72K in acquisition cost inflation or growth stall
I’ve tracked this across 41 operators who implemented monthly strategic shifts vs. 38 who made reactive pivots.
Operators Using the Monthly Strategic Shift System
Average market signals detected: 4.2 per year
Average adaptation investment: $4,800 per signal
Average revenue impact: +6.3% growth through adaptations
Operators Relying on Reactive Pivots Instead of Monthly Strategic Tracking
Average pivots per year: 1.8 (caught fewer signals, reacted bigger)
Average pivot cost: $42,000 per pivot
Average revenue impact: -3.2% during pivot period (disruption cost)
The math is brutal.
Monthly adaptation typically costs $20K–$25K yearly and keeps growth intact.
Reactive pivots typically cost $75K–$85K yearly and blow up momentum.
A consultant at $104K/month ignored market signals for 8 months. “Strategy is working fine.”
When revenue dropped to $89K in month 9:
The market had shifted toward outcome-based pricing (he used hourly)
3 competitors launched productized offerings (he remained custom)
Clients requesting faster delivery (his process has been unchanged for 2 years)
Panic pivot decision: “We’re going fully productized, outcome-based pricing, 2-week delivery.”
Pivot cost:
Complete service redesign → $18K in lost billable time
Client communication chaos → $12K in churn during transition
Positioning confusion → $15K in lost deals (neither old nor new clients clear on offering)
Delivery system rebuild → $8K investment
Total: $53K + 5 months at reduced revenue → $75K total impact.
Had he tracked monthly:
Month 3: Caught first outcome pricing requests (3 clients asking)
Month 4: Noticed competitor positioning shift (2 launching productized)
Month 5: Client feedback pattern (5 mentioning delivery speed)
Strategic shift response:
Month 6: Test outcome pricing with 2 clients (pilot)
Month 7: Launch semi-productized tier (hybrid approach)
Month 8: Optimize delivery process (reduce 4 weeks to 3 weeks)
Investment: $12K over 3 months.
Result: Revenue $104K → $112K through adaptive improvements, no disruption.
He told me, “I used to think pivoting when necessary showed decisiveness. Adapting monthly shows awareness—pivoting just proves you weren’t paying attention.”
The issue isn’t whether you respond to markets; it’s whether you’re tracking them monthly so you can adapt incrementally.
A course creator at $94K/month ran quarterly strategic reviews, not monthly, and felt like that was enough.
Quarter 1: Everything looked stable.
Quarter 2: Revenue at $87K (down $7K).
Found the signals started in month 4:
The platform algorithm changed (organic reach dropped 40%).
A competitor launched a lower-priced offer (market expectation reset).
Students started requesting live components (the recorded‑only model felt outdated).
$7K monthly × 2 months → $14K lost between signal start and quarterly detection.
Quarterly response was a reactive pivot: “We’re now live‑first with community.”
Cost:
$28K to rebuild
4 months of disruption
Had she tracked monthly, she would have caught this in month 4 instead.
Response: Test the live component with 20% of students. Iterate. Scale based on results.
Investment: $6K.
Time: 2 months. No disruption.
That’s the pattern: quarterly reviews catch signals late enough that pivots feel necessary, while monthly tracking catches them early enough that shifts still feel strategic.
You’ve probably felt this tension yourself: “Markets change fast, I need to pivot.”
In reality, markets change continuously, not suddenly, and monthly tracking lets you see those changes accumulate long before they force you into reactive decisions.
60 minutes monthly → 12 hours yearly.
$30K–$60K prevented in panic pivot costs → $2,500–$5,000 value per hour of strategic review time.
That’s the most positioning‑protective hour in your business.
Monthly Strategic Shift In Practice at $100K–$130K/Month
The Monthly Strategic Shift is already mapping your signals. To turn it into a repeatable protection system at $100K–$130K/month, upgrade to premium and get the full implementation support.
Monthly Strategic Shift Framework: 60-Minute Market Response Protocol
This is the exact 60‑minute monthly framework that prevents $30K–$60K in panic pivot costs through incremental adaptation.
Run it on the fourth Friday of every month—same day, same time—then calendar‑block it now so it never gets skipped
Five Strategic Market Signals to Track Every Month
Client Request Patterns (what they’re asking for vs. what you offer)
Competitive Positioning (how competitors are evolving their offers)
Channel Performance (where your growth comes from and ROI trends)
Market Expectations (what’s shifting from premium to standard)
Capability Gaps (where you’re losing deals to more capable competitors)
Minutes 1–15: How to Collect Monthly Strategic Signals
Track changes for each signal category. Use this format:
Signal 1: Client Request Patterns
- Requests matching current offering: _____% (target: >80%)
- Requests requiring new capabilities: _____% (baseline: _____%)
- Most common new request: _______________
- Frequency of request: _____ times this month
Signal 2: Competitive Positioning
- Competitors with similar positioning: _____ (baseline: _____)
- New services launched by competitors: _____ this quarter
- Pricing changes observed: _____ competitors
- Positioning differentiation score: _____/10 (target: >7)
Signal 3: Channel Performance
- Primary channel ROI: _____% (baseline: _____%)
- Secondary channel ROI: _____% (baseline: _____%)
- Channel concentration: _____% from top channel (target: <60%)
- CAC trend: $_____ (baseline: $_____)
Signal 4: Market Expectations
- Premium features requested as standard: _____ this month
- Pricing pressure incidents: _____ clients
- Delivery speed expectations: _____ days (your standard: _____ days)
- Quality standard shifts: _______________
Signal 5: Capability Gaps
- Deals lost to capability gaps: _____ this month
- Lost deal value: $_____
- Most common gap: _______________
- Gap frequency: _____ deals
Compare all signals to baseline (last month or 3-month rolling average).
Minutes 16–30: Trend Analysis for Monthly Market Signals
or each signal, calculate the trend:
Trend formula:
Current − Baseline = Change
Change ÷ Baseline × 100 = % Trend
Flag anything trending >15%.
Example:
New capability requests: 8 this month vs. 3 baseline
Change: 8 − 3 = 5
Trend: 5 ÷ 3 × 100 = 167%
Client impact: 8 of 15 deals (53%) asking for a capability you don’t have
Strategic signal: Market shifting toward this capability, you’re behind
Minutes 31–45: Assessing Monitor/Test/Integrate/Pivot Responses
For each flagged trend, assess response type:
Response Level 1: Monitor (trend 15–25%)
Action: Continue tracking, no change yet
Threshold: If trend reaches 30%, move to Level 2
Response Level 2: Test (trend 26–40%)
Action: Small pilot with 10–20% of clients
Investment: $2K–$5K to test viability
Timeline: 30–60 days to validate
Response Level 3: Integrate (trend 41–60%)
Action: Add capability as a complementary service
Investment: $6K–$12K to build into offering
Timeline: 60–90 days to full integration
Response Level 4: Pivot (trend >60%)
Action: Major repositioning required
Investment: $25K–$50K for significant change
Timeline: 3–6 months for full transition
Note: This should rarely happen with monthly tracking
Example trend assessment:
Video content requests: 8 of 15 deals (53% trend from 20% baseline)
Response Level: 3 (Integrate)
Action: Add video as a complementary service
Investment: Partner with video producer ($8K setup)
Timeline: 60 days to launch
Expected impact: Recover 6 of 8 video‑requesting deals = $36K monthly
Minutes 46–60: Action Protocol for Implementing Strategic Shifts
For each strategic response, assign action:
Trend 1: Video Content Capability Gap (53% of deals requesting)
Action 1: Partner with a video production studio (this week)
Action 2: Train team on video project management (30 days)
Action 3: Update positioning to “integrated content” (immediate)
Timeline: Launch in 60 days
Investment: $8K partnership + $3K training → $11K
Expected recovery: 6 deals monthly → $36K, a 327% ROI in month 1.
Trend 2: Delivery Speed Expectation and Closing the Turnaround Gap
Action: Process optimization (remove 2 non‑value steps)
Timeline: Implement in 30 days
Investment: $2K in process redesign
Expected impact: Close rate improvement 5–8% → $6K–$10K monthly
Document everything. That becomes next month’s baseline.
This isn’t reactive; it’s systematic. The framework captures market signals before they ever build enough pressure to force a pivot.
Omar, marketing agency owner at $118K/month, implemented this exact framework.
Month 1 (June): First strategic shift review
Found video requests: 8 of 15 deals (53%)
Competitive scan: 3 competitors added video in Q1
Channel performance: Referrals strong, ads declining
Response: Integrate video as complementary (not pivot to video‑only)
Investment: $9K video partnership + positioning update
Month 2 (July): Second review
Video requests now: 11 of 16 deals (69% — integrated service resonating)
New signal: Clients asking for retainer vs. project (4 requests)
Competitive scan: 2 competitors launched retainer models
Response: Test retainer with 3 clients (pilot)
Investment: $2K to develop retainer framework
Month 3 (August): Third review
Video integration successful: 8 clients using the combined service
Retainer pilot: 2 of 3 clients converted, higher LTV
New signal: Organic social reach declining 25% (algorithm change)
Response: Shift 20% of content effort to email (owned channel)
Investment: $1K email system upgrade
Month 4 (September): Fourth review
Revenue: $118K → $127K through adaptations (not pivot)
Video service: $22K monthly (new revenue stream)
Retainer conversions: $18K monthly (from 5 clients)
Email channel: Early traction, 200 subscribers added
Total investment over 4 months: $12K
Revenue growth: $9K monthly sustained → $108K annually
ROI: 900% in year 1
No pivot. No disruption. Just monthly signals caught early and strategic shifts implemented incrementally.
He told me, “Monthly strategic reviews are why we adapted smoothly while competitors panic‑pivoted. We saw changes coming; they reacted after the fact.”
That’s the pattern across operators who run this.
The system works because it’s predictable: same day, same time, same 5 signals, same 60 minutes.
No panic. No guessing. Just tracking that catches market shifts while adaptation stays incremental.
Three-Move Monthly Application of the Monthly Strategic Shift System
Here’s how this plays out month-over-month in real operations.
Move 1, Month 1: Establish Baseline and Catch Early Market Signals
Omar started monthly strategic shifts in June.
Never tracked systematically before. “Just watching the market.”
Fourth Friday, June: 60‑minute strategic review.
Found:
Client requests: 8 of 15 deals asking about video (53%)
Competitive positioning: 3 of 8 competitors added video in Q1
Channel performance: Referrals 60%, ads 30%, organic 10%
Market expectations: Delivery speed requests (3 weeks vs. your 5 weeks)
Capability gap: Video production (losing 8 deals monthly)
Baseline established. Key signal flagged: 53% video requests.
Assessment: Response Level 3 (Integrate).
Investigation: Competitors charging $12K–$18K for video. Your deals average $6K written content. Combined offering could be $15K–$20K.
Revenue math:
8 deals monthly at $15K average → $120K potential
Current: $48K (8 deals × $6K)
Opportunity: $72K monthly if video integrated
Action: Partner with a video production studio (revenue share model, low upfront).
Investment: $9K (partnership setup + positioning update + team training).
Timeline: Launch in 60 days.
Result, month 1: Partnership signed, positioning updated from “content agency” to “integrated content agency.”
Revenue impact: 2 deals closed using the new positioning (clients wanted the combined offering), generating $32K that would otherwise have been lost—$32K recovered immediately.
Why it mattered: Caught in month 1 because of systematic signal tracking; without monthly reviews, they would’ve continued losing video deals indefinitely.
Move 2, Month 2: Track Adaptations and Catch New Strategic Signals
July, fourth Friday: second monthly strategic review.
One new signal: Retainer requests appearing (4 clients asking).
Investigation
Retainer pattern:
4 clients (26% of pipeline) are asking about ongoing services.
Competitive scan: 2 competitors launched retainer offerings in Q2.
Market expectation: Shift from project to relationship model.
Your model: 100% project‑based (no retainer option).
Opportunity assessment:
Client LTV:
Project = $6K one‑time.
Retainer = $4K monthly × 8 months avg → $32K.
That’s a 5x LTV increase through the retainer model.
But risk: Don’t pivot entire agency to retainer‑only (disrupts existing model).
Response: Level 2 (Test).
Action: Offer a retainer pilot to 3 interested clients.
Investment: $2K to develop retainer framework (scope, pricing, delivery model).
Timeline: 30‑day pilot. Fixed within 30 days of signal detection.
If ignored until it becomes a 60% trend, the cost is a full pivot ($30K to rebuild the delivery model), whereas monthly reviews catch signals at the Test phase (26%), long before they escalate to the Pivot phase.
Move 3, Months 3–12: Systematic Adaptation and Signal Prevention
August through May: Monthly reviews every fourth Friday.
Over 10 months, he caught 8 strategic signals and handled each one deliberately.
3 capability gaps (video, retainer, social media management) — integrated incrementally.
2 positioning shifts (pricing, bundles) — adjusted before they eroded his edge.
2 channel changes (ad costs up, email emerging) — diversified before crisis.
1 expectation shift (faster delivery) — optimized process before losing deals.
Total caught early: 8 strategic signals requiring adaptation.
Total adaptation investment: $24K over 10 months.
Revenue trajectory: $118K → $127K stable over 4 months, $135K by month 10.
Growth: $17K monthly (+14.4%) through strategic adaptations vs. competitors who panic‑pivoted.
He told me, “The monthly review is why we grew while competitors struggled. We adapted continuously while they pivoted hard and lost momentum.”
That’s the difference: operators who adapt run monthly signal tracking; operators who pivot rely on reactive crisis response.
A service business owner at $112K/month missed his October review (busy with client delivery).
November review: close rate at 38% (baseline 52%). 14‑point drop.
Investigation:
Trend started in October.
Competitor launched an AI‑enhanced service (faster delivery at a lower price).
Market expectations reset overnight.
Math:
$112K × 14% close rate drop = $15,680 monthly opportunity cost
$15,680 × 2 months = $31,360 lost
Reactive decision: “We need AI integration immediately.”
Rushed pivot cost:
$22K to implement
2 months of disruption at $44K
$31K in opportunity cost
Total impact: $75K
Had he tracked monthly, caught in month 1.
Calm response: Test AI integration with 20% of projects. Validate value. Scale.
Investment: $8K
Time: 60 days
Disruption: none
He told me, “Skipping one month cost me $75K in panic response. I’ll never skip again.”
The ritual works because it’s consistent: miss a month and signals pile up; track monthly and your adaptations stay small and controlled.
A course creator at $126K/month blocks this on the fourth Friday every month and doesn’t miss it.
Over 14 months, she’s avoided an estimated $118K in panic pivot costs by catching signals early and adjusting incrementally.
Average signals caught monthly: 2.4
Average adaptation investment: $3,200 per signal
Average revenue impact: +4.1% growth per adaptation
She told me, “This isn’t strategy consulting; it’s signal tracking. Markets tell you what to do—you just have to listen monthly, not yearly.”
That’s the difference between operators who adapt smoothly and those who pivot desperately: systematic monthly signal tracking instead of hoping markets stay stable.
Hidden $30K–$60K Costs You Miss Without Monthly Strategic Tracking
Here’s what you can’t see without this monthly ritual.
Signal 1: Client Request Pattern Shift Without Monthly Reviews
Client requests don’t flip overnight; they evolve gradually.
This connects directly to the strategic clarity we develop in The Signal Grid — monthly reviews ensure you’re tracking the right signals for market adaptation.
Client request pattern shift (Signal 1)
Starts: 2 requests for new capability (12% of deals).
Evolves: 2 → 3 → 5 → 8 over 6 months (53% of deals).
Monthly change: 5–10% (feels normal).
6‑month impact: 41% increase—half your market now wants something you don’t offer.
Economics at $10K average deal size
Deal size: $10K average.
Volume: 8 deals monthly.
Opportunity cost: $80K monthly if you can’t serve.
Caught early vs late
Caught in month 2 (when 3 of 15 deals is 20%) — Test and integrate.
Investment: $6K
Recovery: 7 of 8 deals, $70K monthly
Caught in month 8 (when 8 of 15 deals is 53%) — Major capability build.
Investment: $25K
Disruption: 3 months
Why monthly tracking matters
Monthly tracking catches this when 20% of deals show the pattern (Test phase), not when it’s already at 53% and forcing an Integrate or Pivot response.
Signal 2: Competitive Positioning Evolution Without Monthly Monitoring
Competitors don’t broadcast their strategy changes; they quietly evolve their offerings, one move at a time.
Competitive positioning evolution (Signal 2)
Pattern: 1 competitor repositions → attracts client attention → 2 more follow within 60 days → positioning becomes standard within 6 months.
At $120K/month: If 3 competitors reposition and you don’t, you’re now “the old option.”
Revenue impact
Impact: a 10–15% deal loss to “newer, better” positioning, costing $12K–$18K in monthly revenue.
Why monthly scans matter: Monthly competitive scans catch this at 1 competitor (early signal), not 3 competitors (behind curve).
Signal 3: Channel Performance Degradation Without Ongoing Tracking
Acquisition channels don’t collapse overnight; their ROI erodes by 2–5% each month as markets saturate or algorithms shift in the background.
Channel CAC drift over 6 months
Starts: Primary channel $150 CAC.
Degrades: $150 → $165 → $182 → $200 over 6 months.
Monthly change: 3–5% (feels like variance).
6‑month impact: a 33% CAC increase means the same budget buys 25% fewer clients.
Economics at $30K monthly ad spend
Spend: $30K monthly.
Efficiency loss: 33%.
Wasted: $10K monthly → $120K annually.
Why monthly channel tracking matters
Monthly channel tracking catches this when there’s a 10% degradation, which is early enough to adjust budget or test a new channel, not after a 33% degradation when you’re already in a channel crisis.
Signal 4: Market Expectation Drift When Premium Becomes Standard
What was premium yesterday quietly becomes standard today, as market expectations shift 10–20% a year without any announcement or warning.
Market expectation drift (Signal 4)
Pattern: 1 competitor adds a feature as a premium → it becomes expected → you’re now missing a “standard” feature.
Impact on pricing and margin
Impact: Pricing pressure (clients expect the feature at the same price) or capability gap (clients choose a competitor).
At $120K/month, 5–10% pricing pressure means $6K–$12K in monthly margin erosion.
Why monthly expectation tracking matters
Monthly expectation tracking catches this when 15–20% of clients mention it, while it’s still an emerging standard, instead of waiting until 60% mention it and it has already become the standard.
Signal 5: Capability Gap Accumulation When You Lose on Capability
You don’t suddenly drop out of the competitive set; you lose deals, bit by bit, to competitors who are better equipped than you are.
Capability gap accumulation (Signal 5)
Starts: 1 deal lost to a capability gap (7% of the pipeline).
Accumulates: 1 → 2 → 3 → 5 over 6 months (33% of pipeline).
Each deal: $10K average.
6 months: 18 total deals lost → $180K opportunity cost.
Caught early vs late
Caught in month 2 (when 2 of 15 deals is 13%) — small integration.
Investment: $4K
Recovery: 80% of gap deals
Caught in month 8 (when 5 of 15 deals is 33%) — major capability build or partnership.
Investment: $18K
Time: 3–4 months
Why monthly tracking matters
Monthly tracking catches capability gaps when they’re still in the 13–20% range, where you can address them calmly, instead of at 33–40%, when they’ve become critical and expensive to fix.
Average annual findings across 41 operators
2.8 client request pattern shifts
(avg $6K investment each, $42K monthly opportunity) → $141K captured yearly.
1.9 competitive positioning evolutions
(avg $4K adaptation each, $18K monthly retained) → $103K protected yearly.
2.3 channel performance degradations
(avg $3K pivot each, $8K monthly saved) → $55K efficiency yearly.
1.7 capability gaps identified
(avg $8K integration each, $24K monthly recovered) → $122K captured yearly.
Total economic tilt of monthly tracking
Total annual value: $421K opportunity captured/protected through 12 hours yearly of systematic tracking.
That’s $35,000 value per hour of strategic review time.
That’s not market analysis. That’s math catching what evolves silently.
At $100K–$130K/month, that’s the hidden tilt monthly tracking creates before you ever touch the heavier economics of pivots versus small adaptations.
Monthly Strategic Adaptation vs Quarterly and Yearly Pivots
Here’s the cost difference between monthly strategic shifts and quarterly/yearly reactive pivots.
Example: Market Capability Gap (Video Content Requests)
Use this pattern:
Monthly Detection & Adaptation (caught at 20% trend in month 2):
Signal strength: 3 of 15 deals (20%)
Response type: Test (Level 2)
Investment: $6K (partnership setup)
Timeline: 60 days to integration
Revenue impact: +$18K monthly from recovered deals
Total cost: $6K investment, $6K opportunity cost during setup = $12K
Quarterly Detection & Integration (caught at 45% trend in month 6):
Signal strength: 7 of 15 deals (47%)
Response type: Integrate (Level 3)
Investment: $14K (internal capability build)
Timeline: 90 days to launch
Revenue impact: +$42K monthly from recovered deals
Opportunity cost during 6 months: $18K × 6 = $108K lost
Total cost: $14K investment + $108K opportunity → $122K
Yearly Detection & Pivot (caught at 65% trend in month 12):
Signal strength: 10 of 15 deals (67%)
Response type: Pivot (Level 4)
Investment: $35K (major repositioning)
Timeline: 4 months to full transition
Revenue impact: +$60K monthly from recovered deals
Opportunity cost during 12 months: $18K × 12 = $216K lost
Transition disruption: $24K (reduced capacity during pivot)
Total cost: $35K + $216K + $24K = $275K
The math is brutal: monthly adaptation runs about $12K a year, while a yearly pivot can easily reach $275K in costs and lost opportunities—a 23x difference.
Year 1 review found:
Client requests shifted toward group programs (65% asking, you offer only 1‑on‑1)
Competitive landscape: 5 of 8 competitors launched group offerings
Pricing pressure: 1‑on‑1 pricing down 20% as groups became expected
Revenue impact: $108K → $94K over 12 months (‑13%)
Investigation traced signals:
Group program requests started in month 3 = 9 months undetected
Month 3–12: Estimated 90 clients asked about groups (7–8 monthly)
Deals lost: 54 (60% of group‑interested clients went to competitors)
Opportunity cost: 54 clients × $2K avg = $108K
Pivot decision: “We’re launching group programs.”
Pivot cost:
Program design and curriculum: $18K
Platform and infrastructure: $12K
Marketing repositioning: $8K
3‑month transition period (reduced 1‑on‑1 capacity): $21K
Total: $59K combined cost + $108K opportunity cost → $167K total impact.
Had he tracked monthly:
Month 3: Caught at 15% (2 of 15 clients asking)
Response: Test group pilot with 8 clients
Investment: $6K (pilot program design)
Timeline: 60 days to launch, 60 days to validate
Result:
Groups added as a complementary offer, not a replacement.
Revenue moved from $108K to $118K, a 9.3% increase.
Total cost: $6K investment + $8K opportunity cost (2 months) = $14K
Savings: $153K through monthly adaptation vs. yearly pivot.
He told me, “Yearly planning feels strategic. It’s expensive. Monthly tracking feels tactical. It’s protective. I had it backwards.”
That’s the pattern: monthly tracking costs 12 hours a year, while yearly pivots cost $150K–$250K in opportunity and disruption.
Fourth Friday Monthly: 60‑Minute Market Protection Ritual.
You’ve seen the math, the signal patterns, and the cost of delayed adaptation—here’s how to implement this starting next month.
Setup Checklist: One-Time 30-Minute Monthly Strategic Shift Configuration
Identify your 5 signal sources
Where do client requests come from? (CRM, sales calls, support tickets)
How do you track competitors? (websites, LinkedIn, industry groups)
Where is channel data? (ads manager, analytics, CRM)
How do you capture market expectations? (client feedback, lost deal notes)
How do you track capability gaps? (lost deal reasons, competitor wins)
Create a signal tracking spreadsheet
5 tabs (one per signal category)
Monthly columns for trend tracking
Baseline column for comparison
Response action column
Calendar block fourth Friday
9:00 AM – 10:00 AM (or your preferred hour)
Recurring monthly
Mark as “busy” (non‑negotiable)
Monthly Protocol: 60-Minute Fourth Friday Strategic Shift Routine
Minutes 1–15: Collect Data for All Five Signals
Pull client request data (deals closed/lost, what they asked for)
Scan competitor websites/positioning (changes noted)
Review channel performance (ROI, CAC, conversion trends)
Check client feedback (expectations mentioned)
Analyze lost deals (why lost, to whom)
Minutes 16–30: Analyze Trends and Flag Strategic Thresholds
Minutes 16–30: Analyze Trends and Flag Strategic Thresholds
Compare the current month to the baseline
Calculate percentage trends
Flag trends >15%
Estimate revenue impact if unchanged
Minutes 31–45: Response Assessment
Classify each flagged trend (Monitor/Test/Integrate/Pivot)
Estimate investment required
Set timeline for each response
Estimate expected revenue impact
Minutes 46–60: Action Protocol
Assign actions for Test/Integrate responses
Set timeline (typically 30–90 days)
Document investment and expected return
Schedule follow‑up verification
The Cost of Skipping:
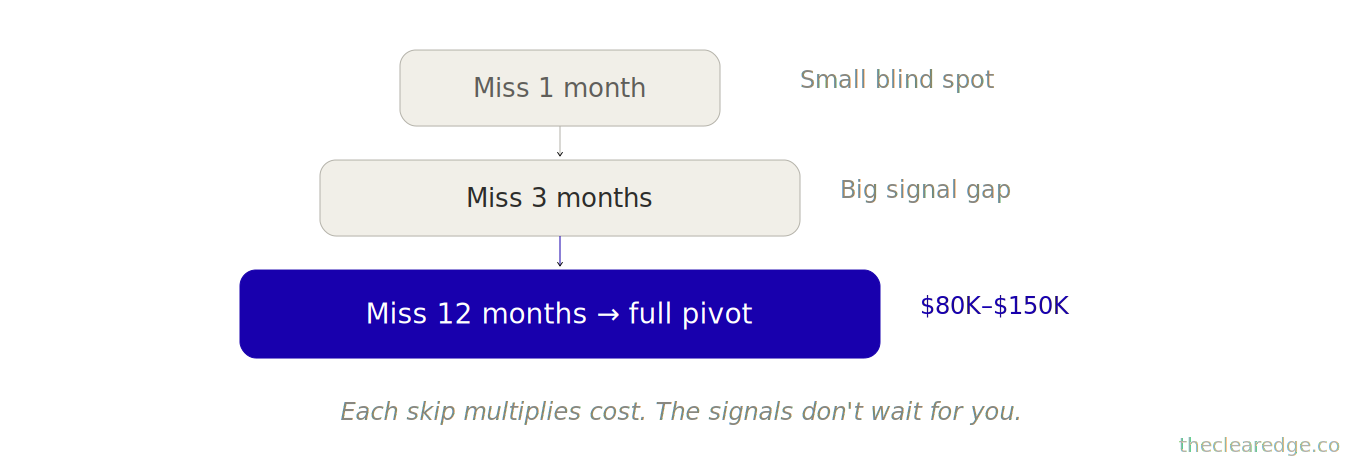
Miss one month: $4K–$8K in undetected signal accumulation.
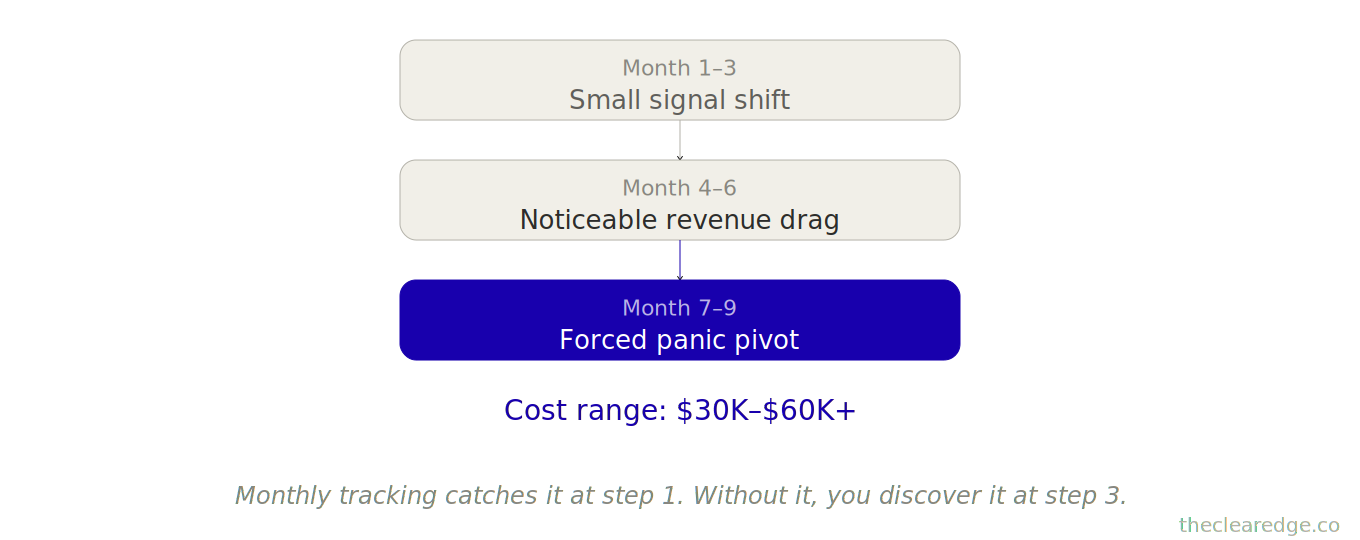
Miss three months: $15K–$25K in delayed adaptation costs.
Miss twelve months: $80K–$150K in panic‑pivot costs from accumulated signals.
60 minutes monthly prevents at least $30K–$60K in pivot costs each year.
A marketing agency owner at $114K/month skipped 3 months of strategic reviews (busy with delivery).
When he returned to monthly tracking:
Client requests shifted 35% toward new capability (was 12% three months ago)
2 competitors launched this capability in the gap
Lost 14 deals to the capability gap over 3 months → $140K opportunity cost
Response now required: Major integration (Level 3/4 boundary).
Investment: $18K
Timeline: 90 days
Had he tracked monthly:
Caught at 18% in month 1
Response: Test (Level 2)
Investment: $6K
Timeline: 60 days
Savings: $132K opportunity cost + $12K investment difference → $144K.
He told me: “Skipping three months cost me $144K in harder, more expensive adaptation. I’ll never skip again.”
That’s the economics: this isn’t strategic planning, it’s month‑to‑month signal protection for your market position.
The Monthly Strategic Shift isn’t about predicting markets; it’s about tracking the 3–5 signals that show what’s changing before they force $30K–$60K panic pivots.
Run it for 60 minutes on the fourth Friday of every month—a $100K–$130K business can’t afford to skip this ritual.
Start next Friday.
Monthly Tracking Or Expensive Pivots
At $100K–$130K/month, skipping monthly tracking means trading 12 calm hours of Monthly Strategic Shift for $30K–$60K panic pivots; protect your calendar, not your denial.
Run the Monthly Strategic Shift Reality Check Checklist
Fourth Friday of every month, run this 60‑minute pass before you green‑light any strategic change.
☐ Pulled the five strategic signals (client requests, competitors, channels, expectations, capability gaps) and wrote this month’s numbers against last month’s baseline.
☐ Calculated percentage trend for each signal, flagged anything over 15%, and wrote the estimated monthly revenue impact if you don’t respond.
☐ Assigned each flagged signal to Monitor, Test, Integrate, or Pivot and wrote the matching dollar investment and 30–90 day adaptation plan.
☐ Logged this month’s signals, responses, and projected cost avoided so you can see whether you’re preventing the next $30K–$60K panic pivot.
Sixty disciplined minutes here regularly beats financing the next $53K–$81K pivot bill out of your $100K–$130K/month run rate.
Where to Go From Here: Install the Monthly Strategic Shift and Stop Funding Panic Pivots
You’re operating at $100K–$130K/month, and every month you skip this 60-minute review you’re quietly accepting the $30K–$60K panic pivot tax you just saw in Omar’s $81K rebuild and the $53K–$75K consultant cases.
From here, treat the Monthly Strategic Shift as a fixed part of your operating system, not a “when I have time” strategy block:
Block a recurring fourth‑Friday, 60‑minute slot and set up your five‑signal dashboard (Client Requests, Competitive Positioning, Channels, Expectations, Capability Gaps) as your single source of truth.
Run the full signals → trend → response (Monitor/Test/Integrate/Pivot) ladder every month, so shifts get handled with $6K–$12K tests and integrations instead of $35K–$75K pivots that burn 3–6 months of momentum.
Use each review to make one concrete strategic move, keeping adaptations in the 15–40% zone that lift you from around $118K toward $127K–$135K instead of paying the next $30K–$60K to rebuild under pressure.
That’s how one fourth‑Friday, 60‑minute ritual becomes the most positioning‑protective hour in your business and stops normal market drift from turning into your next panic pivot bill.
FAQ: Monthly Strategic Shift System for $100K–$130K/Month Operators
Q: How do I know if I actually need the Monthly Strategic Shift at $100K–$130K/month?
A: You need it when you’re at $100K–$130K/month, reacting to market changes only when revenue drops, and your last “strategic review” was quarterly or yearly even though client requests, competitors, and channels are clearly shifting.
Q: How much do reactive, panic pivots really cost without this Market Response Protocol?
A: Across examples like Omar and the $104K consultant, reactive pivots at this stage routinely cost $53K–$81K in direct pivot expenses plus $30K–$75K in lost revenue and disruption, adding up to $75K–$150K per major pivot cycle.
Q: How does the Monthly Strategic Shift prevent the $81K panic pivot Omar experienced?
A: By running a 60-minute fourth-Friday review of five signals, Omar would have caught video demand when it was a 15–20% trend, spent around $9K–$12K integrating video as a complementary service, and turned the shift into a $9K–$17K monthly lift instead of paying an $81K, 6‑month panic pivot bill.
Q: How do I use the Monthly Strategic Shift with its Monitor/Test/Integrate/Pivot levels before making another big strategic change?
A: Each month you quantify five signals—Client Requests, Competitive Positioning, Channel Performance, Market Expectations, Capability Gaps—calculate percentage trends, and map each one to Monitor at 15–25%, Test at 26–40%, Integrate at 41–60%, or Pivot above 60%, so you spend $2K–$12K on 30–90 day tests and integrations instead of $25K–$50K on 3–6 month pivots.
Q: What happens if I keep relying on quarterly or yearly strategy reviews instead of this 60-minute monthly ritual?
A: Signals that start as 3–5% shifts quietly compound into 20–40% gaps over 6–12 months, so you only notice them once revenue has slid from, say, $104K to $89K or $94K to $87K and are then forced into $53K–$81K pivots and 4–5 months of disruption rather than $6K–$12K incremental adaptations.
Q: How did Omar turn a potential $81K pivot into a $108K–$135K growth path with the Monthly Strategic Shift?
A: By catching video requests at 53%, testing and then integrating video over 60 days with about $9K–$12K of spend, layering in retainers and email adjustments over the next 3–4 reviews, and lifting revenue from $118K to $127K in 4 months and then to $135K by month 10 without tearing down his existing model.
Q: How much time and money does the Monthly Strategic Shift actually require compared to what it protects?
A: Setup takes 30 minutes once, then 60 minutes on the fourth Friday of each month plus targeted 30–90 day micro-adaptations totalling roughly 12 hours a year and $20K–$25K in planned investments to avoid $75K–$85K in annual pivot costs and protect $75K–$150K in momentum and positioning.
Q: How do I decide whether a new pattern—like group program requests or outcome-based pricing—deserves a test, integration, or full pivot?
A: When a signal hits around 15–25% (for example 3 of 15 clients asking for groups) you run a $4K–$6K test with 10–20% of clients; if it grows into the 40–60% range you invest $6K–$12K to integrate it as a complementary offer, and only when it passes 60% and clearly reshapes the market do you consider a $25K–$50K pivot.
Q: How quickly can the Monthly Strategic Shift start changing results once implemented?
A: In the case studies, operators who begin the fourth‑Friday ritual often catch 1–2 meaningful signals in the first 60 minutes, launch small tests within 30–60 days, and see measurable revenue protection or growth—such as $6K–$10K monthly from delivery-speed improvements or $18K–$36K from capability adds—inside 2–3 cycles.
Q: Why does not running the Monthly Strategic Shift keep turning normal market evolution into $30K–$60K panic pivots?
A: Because without structured monthly signal tracking, client requests, competitor moves, and channel shifts build quietly from 5–10% to 40–60% while you’re busy delivering, so by the time you notice the problem you’ve already accumulated $30K–$60K in opportunity cost and now need a full $53K–$81K pivot instead of a calm $6K–$12K adjustment.
⚑ Found a Mistake or Broken Flow?
Use this form to flag issues in articles (math, logic, clarity) or problems with the site (broken links, downloads, access). This helps me keep everything accurate and usable. Report a problem →
› More to Explore: Quick Navigation · Monthly Rituals
➜ Help Another Founder, Earn a Free Month
If this system just saved you from paying a $53K–$81K panic pivot bill, share it with one founder who needs that relief.
When you refer 2 people using your personal link, you’ll automatically get 1 free month of premium as a thank-you.
Get your personal referral link and see your progress here: Referrals
Get the Monthly Strategic Shift Implementation Toolkit
You’ve read the system. Now implement it.
Premium gives you:
Ready-to-use PDF toolkit—every template, diagnostic, and formula pre-filled, zero setup, immediate use
Plug-and-play AI diagnosis sessions—drop into Claude, Gemini or ChatGPT, answer a few questions, save hours of guessing, get your exact next move
Audio key points—concentrated frameworks you can absorb in minutes, implement while you move
Unrestricted access to the complete library—every system, every update
What this prevents: Another $53,000–$81,000 panic pivot triggered by market signals you noticed 6–12 months too late.
What this costs: $12/month. Full access to the tools that turn this article into a repeatable Monthly Strategic Shift.
Download everything today. Implement this week. Cancel anytime, keep the downloads.
Already upgraded? Scroll down to download the PDF, audio, and your AI session.
