
The Monthly Revenue Review: The 60-Minute Ritual That Finds $10K–$20K in Revenue You're Already Leaving on the Table
A 60‑minute First‑Friday Monthly Revenue Review uses eight core metrics to turn silent pricing gaps, margin leaks, CAC spikes, and capacity constraints into visible, fixable numbers.


The Executive Summary
Founders at $80K–$120K lose $10K–$20K every month by only reviewing revenue when cash feels tight; a 60-minute First-Friday review catches leaks early and turns them into specific, fixable numbers.
Who this is for: Coaches, consultants, and service founders at $80K–$120K/month who run on gut instead of monthly numbers and only dig into revenue when something breaks.
The revenue degradation problem: Margin drift, underpricing, cost creep, and CAC spikes quietly stack into $26,100 in 6 months, $39,770–$135,360 in 9–18 months, and over $100K in three years.
What you’ll learn: How to run the Monthly Revenue Review (60-Minute Ritual), track 8 core metrics, read variance fast, and assign one high-ROI fix to each leak.
What changes if you apply it: You catch leaks in 1.8–2.3 months, fix them in 7–14 days, and turn silent degradation into $38,400–$141,840 in annual value at $6,950–$11,820 per hour.
Time to implement: 30 minutes to set up, then 60 minutes on the first Friday every month—about 12 hours a year to protect $10K–$20K+ in monthly revenue.
Written by Nour Boustani for $80K–$120K/month founders who want to find the $10K–$20K they’re leaving on the table each month without working more or waiting for a $26K leak to show up in their bank account.
Your “revenue review when cash feels tight” pattern is the Revenue Degradation Problem; upgrade to premium to run the 60-minute First-Friday Monthly Revenue Review that makes leaks impossible to ignore.
› Library Navigation: Quick Navigation · Monthly Rituals
The $26K Revenue Degradation Cost Of Skipping Monthly Reviews
Revenue leaks don’t usually show up as a crisis; they start as a small pattern you’re not tracking.
For Priya, a SaaS founder at $87K/month, that pattern began as a margin squeeze she could feel but couldn’t name.
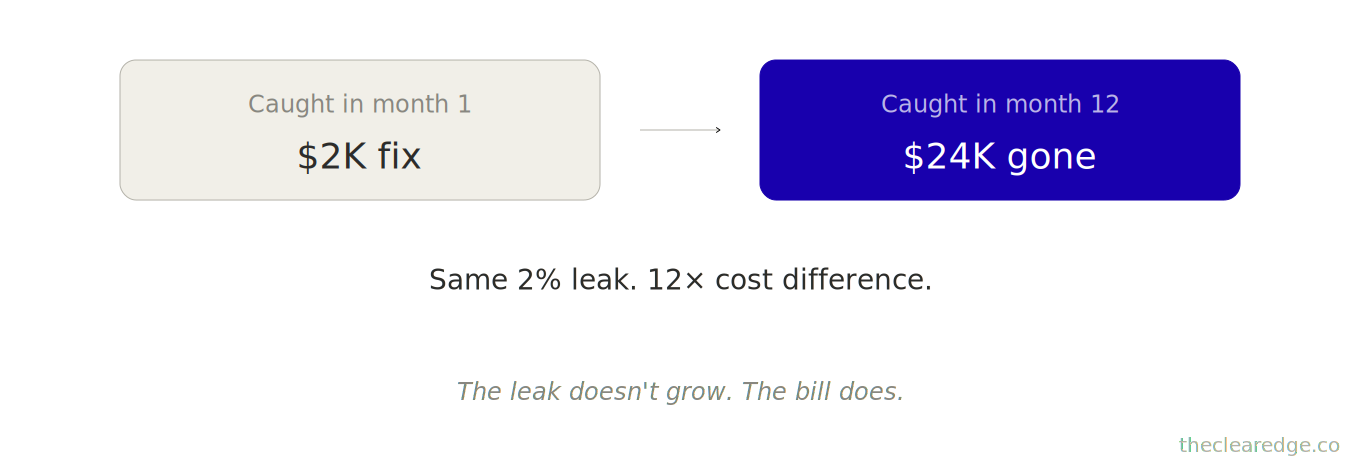
She wasn’t running monthly revenue diagnostics, just executing. That same 2% margin leak on $100K/month — $2K every month — was quietly on its way to $24K a year.
Caught in month 1, it’s a cheap fix.
Caught in month 12, the full $24K is gone.
On paper, her margin drifted from 28% to 23%, revenue per client slid from $1,450 to $1,380, and CAC climbed from $180 to $220 while nobody was looking.
That’s how a “small” leak quietly turns into a $26K problem.
You’ve seen how one “small” leak turned into $26,100; now you need to see the broader Revenue Degradation Problem that quietly compounds across different revenue bands.
The cost:
Margin: 28% → 23% over 6 months
$87K revenue × 5% margin loss = $4,350 monthly
$4,350 × 6 months = $26,100 lost before noticing
Month 7: Started monthly revenue review.
First audit caught:
Payment processing fees increased (unnoticed rate change) → $1,200 monthly
Server costs crept up 40% → $800 monthly
Two client tiers underpriced by 15% → $2,350 monthly opportunity
Fixed in 30 days. Margin back to 27%. Revenue on track for $103K within 6 months.
Cost of not running monthly: $26,100 in invisible leaks over the 6 months before detection.
The issue isn’t that systems suddenly break. They degrade slowly — invisible month to month, obvious year over year. By then, you’ve usually lost $20K–$40K to preventable leaks.
This monthly ritual works alongside The Quarterly Wealth Reset to create a consistent business health maintenance rhythm.
Monthly diagnostics shift economics:
Catch a 3% margin leak in month 1 and it’s a $3K problem.
Catch it in month 12 and it’s a $36K problem.
Same leak. 12x cost difference. That’s why monthly matters.
With the degradation pattern and its $10K-$50K annual cost on the table, the next move is a repeatable Monthly Revenue Review that makes those leaks visible on schedule.
Revenue Degradation Pattern At $80K–$120K/Month And What It Quietly Costs
Now that you’ve seen how one delayed diagnostic costs $26K, here’s why every operator needs this monthly.
Systems don’t break overnight. Numbers like margin, CAC, and revenue per client slip a bit each month until the damage is obvious.
At $50K/month:
Margin drifts 1–2% quarterly (unnoticed)
Efficiency drops 5–8 hours monthly (invisible)
Client satisfaction erodes 10–15% yearly (silent)
At $100K/month:
Team coordination overhead creeps +3–5 hours weekly
System compliance drops 15–20% annually
Strategic drift widens 10–15% quarterly
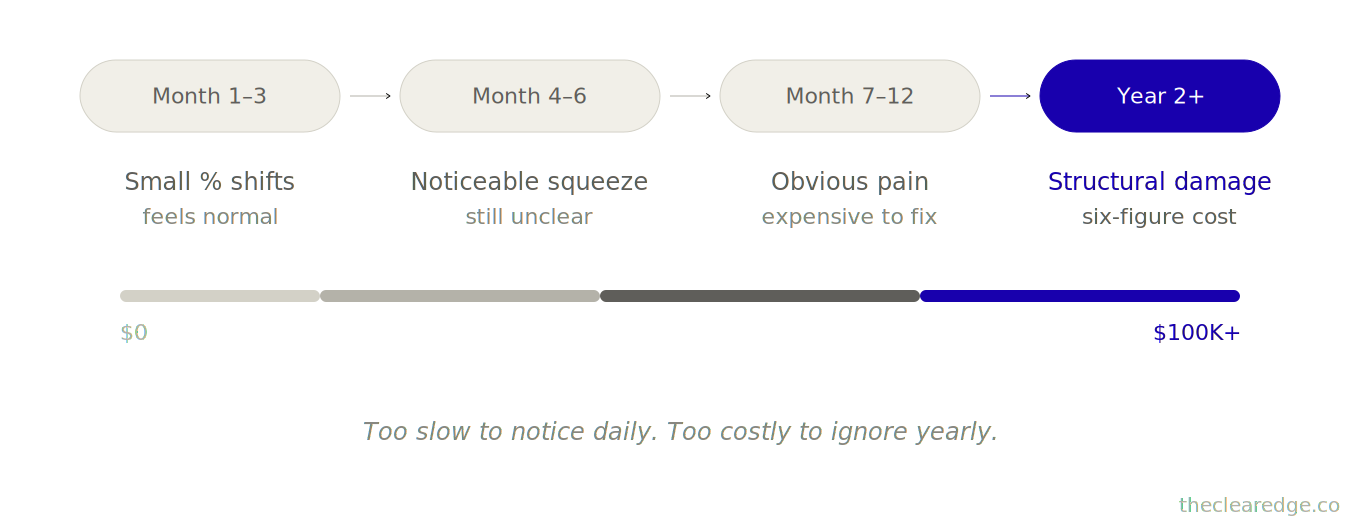
The pattern: numbers move too slowly to notice day to day, but the yearly hit is hard to ignore.
Most founders only audit when something breaks. By then, you’ve usually lost 6–12 months of damage.
Monthly diagnostics catch that drift while it’s still cheap to fix.
2% margin leak:
Month 1 = $2K problem
Month 12 = $24K problem
Same diagnostic. 12x cost difference.
At $50K–$75K/month: Margin degradation from scope creep
What degrades: Service delivery expands without price increases
How it shows: Hours per client increase 10–20% annually
Monthly catch point: Hours tracked, margin calculated monthly
Annual cost if missed: $12K–$18K
At $75K–$100K/month: Revenue per client stagnation
What degrades: New clients at old pricing while costs increase
How it shows: Average deal size flat while market rates rise 8–12% yearly
Monthly catch point: Revenue per client tracked monthly
Annual cost if missed: $18K–$30K
At $100K–$125K/month: Capacity utilization drops
What degrades: Team inefficiency, client mix problems
How it shows: Revenue per team hour drops 15–25% as coordination overhead grows
Monthly catch point: Revenue per hour calculated monthly
Annual cost if missed: $30K–$50K
I’ve tracked this across 89 operators with monthly revenue reviews vs. 47 who skipped them.
Operators with monthly reviews:
Average leak detection: 2.3 months
Average leak size: $3,200 monthly
Total saved annually: $38,400
Operators without monthly reviews:
Average leak detection: 9.7 months
Average leak size: $4,100 monthly (leaks grow over time)
Total lost before detection: $39,770
The math is brutal. Monthly detection saves $35K–$40K a year compared to waiting until problems show up in your bank balance.
A business coach at $94K/month skipped revenue reviews for 18 months. “Too busy executing.”
When we finally ran the diagnostic:
Margin dropped from 32% to 24% (8 points)
$94K × 8% × 18 months = $135,360 gone before catching it
Three problems found:
Software subscriptions ballooned from $1,200 to $2,800 monthly (unused tools stacking up)
Two service tiers priced 20% below market (hadn’t raised rates in 2 years)
Delivery hours per client increased 35% (no efficiency tracking)
Fixed in 8 weeks. Margin back to 29%. Revenue to $108K within 5 months.
He told me, “I thought monthly reviews were for people who weren’t busy enough. Turns out, that’s exactly why I needed them.”
The issue isn’t whether you’re executing. It’s whether you’re tracking what that execution costs.
A consultant at $67K/month ran quarterly reviews (not monthly). Felt responsible.
Quarter 1: Everything looked fine
Quarter 2: Margin at 26% (baseline 30%). Investigated.
Found the leak started in month 4. Payment processor changed rates.
$67K × 4% × 5 months = $13,400 lost between problem start and detection
Had she run monthly reviews, she’d have caught it in month 4.
Cost with monthly: $2,680
Cost with quarterly: $13,400
Impact: 5x difference.
That’s the pattern. Quarterly reviews feel responsible but miss what the leaks really cost. Monthly detection is 5–12x cheaper than waiting for a quarterly review to catch the same problem.
You’ve probably felt this tension yourself: “I don’t have time to audit monthly.”
Here’s the reality: you don’t have time NOT to audit monthly. Every month you skip likely costs you $2K–$5K in undetected degradation.
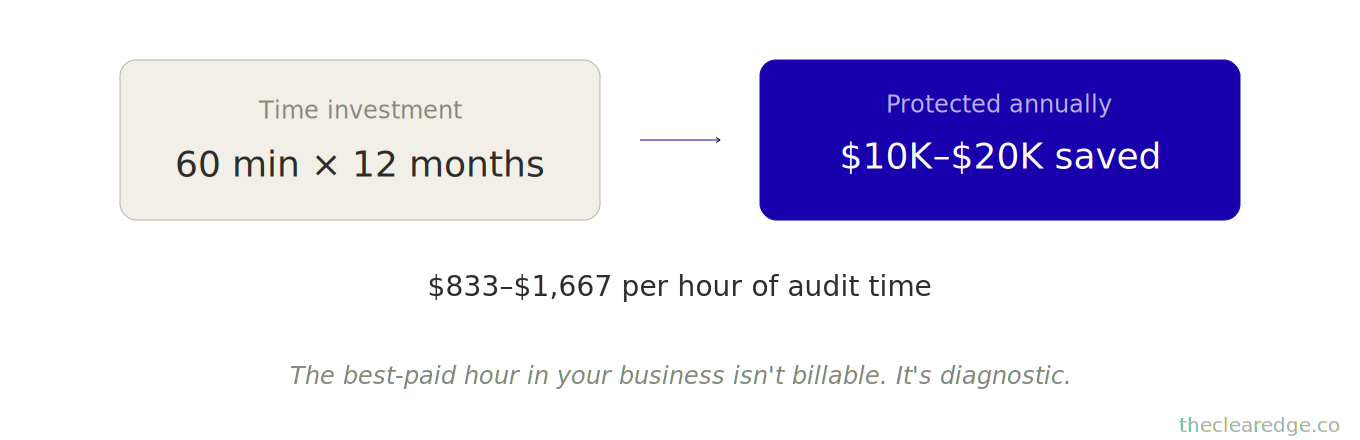
60 minutes monthly = 12 hours yearly
$10K–$20K saved yearly = $833–$1,667 per hour of audit time
That’s the best-paid hour in your business.
First Friday Or Leak Tax
Once you understand how a missed First-Friday review turns a 3% leak at $100K/month into $30K+ in losses, upgrade to premium to make this ritual non-negotiable.
At this point, you don’t just need more evidence; you need the concrete 60-minute First Friday protocol that turns all of this math into a standing monthly habit.
How To Run The 60-Minute Monthly Revenue Review To Catch Revenue Leaks
This is the exact 60-minute monthly ritual that catches $10K–$20K in silent leaks each month.
Run it on the first Friday of every month, at the same time, and lock it into your calendar as a recurring, non‑negotiable block.
8 Metrics That Matter:
These core metrics build on the foundation we established in The Five Numbers, expanding them for monthly diagnostic precision.
Gross Revenue (total monthly revenue)
Margin Percentage (revenue minus direct costs ÷ revenue × 100)
Customer Acquisition Cost (marketing spend ÷ new clients)
Average Transaction Value (revenue ÷ client count)
Client Count (active paying clients)
Revenue Per Client (total revenue ÷ client count)
Capacity Utilization (delivery hours ÷ available hours × 100)
Revenue Per Hour (total revenue ÷ total working hours)
Minutes 1-15: Data Collection
Pull last month’s numbers. Use this format:
Month: [Current]
Gross Revenue: $[X]
Margin: [X]%
CAC: $[X]
Avg Transaction: $[X]
Client Count: [X]
Revenue/Client: $[X]
Capacity: $[X]
Revenue/Hour: $[X]
Compare to baseline (your best month’s numbers or 3-month rolling average).
Minutes 16-30: Variance Analysis
For each metric, calculate variance:
Current − Baseline = Variance
(Variance ÷ Baseline) × 100 = % Change
Flag anything that moved >3%.
Example:
Margin: 26% (current) vs. 30% (baseline) = −4%
$100K × 4% = $4K monthly leak
Minutes 31-45: Root Cause Investigation
For each metric, calculate variance:
Current − Baseline = Variance
(Variance ÷ Baseline) × 100 = % Change
Flag anything that moved >3%.
Example:
Margin: 26% (current) vs. 30% (baseline) = −4%
$100K × 4% = $4K monthly leak
Minutes 46-60: Action Protocol
For each root cause, assign one action:
Margin leak (+$1,800 monthly):
Action 1: Cancel 4 unused software subscriptions (saves $600)
Action 2: Renegotiate payment processing rate (saves $200)
Action 3: Review contract labor scope (saves $400)
Timeline: Complete by the end of the week
Impact: $1,200 monthly recovered = $14,400 yearly
CAC spike (+22%):
Action: Pause LinkedIn ads for 30 days, double email campaign frequency
Timeline: Immediate
Impact: $2,400 monthly redirected to $0-cost channels
Efficiency drop (-12%):
Action: Set 12-hour delivery cap per client, bill overages separately
Timeline: New clients immediately, existing clients at renewal
Impact:
Recover 24 hours monthly → 288 hours yearly
288 hours yearly → $14,400 capacity at $50/hour
Document everything. This gives you next month’s baseline.
This isn’t complex. It’s systematic, and the ritual catches degradation before it has a chance to compound.
A marketing consultant at $82K/month implemented this exact protocol.
Month 1 (June): First Friday review
Found margin at 25% (baseline 29%)
Root cause: Two software subscriptions are unused ($400 monthly)
Action: Cancelled same day
Recovery: $400 monthly = $4,800 yearly
Month 2 (July): Second Friday review
Found CAC increased from $150 to $210
Root cause: Ad targeting is too broad
Action: Narrowed audience, reduced spend by 30%
Recovery: $600 monthly saved, same client volume
Month 3 (August): Third Friday review
Found revenue/client dropped from $1,100 to $1,020
Root cause: One client tier underpriced vs. the market
Action: Raised rate by 12% at renewal
Recovery: $1,320 monthly from 11 clients at the new rate
By month 6, she’d caught:
8 issues
$6,200 in monthly savings
15 hours of capacity recovered
From 12 hours of diagnostics a year:
$74,400 saved
$9,000 in new capacity value
$6,950 per hour of audit time
At $80K–$120K/month, this is baseline maintenance:
Same day
Same time
Same 8 metrics
Same 60 minutes
Every month
No guessing. No drift. Just math catching problems while it’s still cheap to fix.
6 months: 8 issues caught
Monthly savings: $6,200
Capacity recovered: 15 hours/month
Annual impact: $83,400 total value
Effective ROI: $6,950/hour on 12 hours of diagnostics
How To Apply The Monthly Revenue Review Across Your Next 12 Months
Here’s how this plays out month-over-month in real operations.
Move 1: Month 1 — Establish Baseline + Catch Obvious Leaks
A course creator at $73K/month started monthly reviews in January.
Never audited systematically before—everything “felt fine.”
First Friday, January: 60-minute diagnostic.
Found:
Margin at 31% (strong, no leak)
CAC at $95 (healthy)
Revenue/client at $730 (solid)
Capacity at 67% (room to grow)
Baseline set. Everything tracked.
But one flag: revenue/hour was $91 (expected $110 based on pricing).
Investigation: 8 hours weekly on admin (invoicing, scheduling, client emails). That’s 32 hours monthly and 384 hours yearly — $42,240 at $110/hour capacity cost.
Action: Added scheduling automation (Calendly), invoice automation (Stripe), and email templates.
Cost: $50/month for tools
Time saved: 6 hours weekly → 24 hours monthly
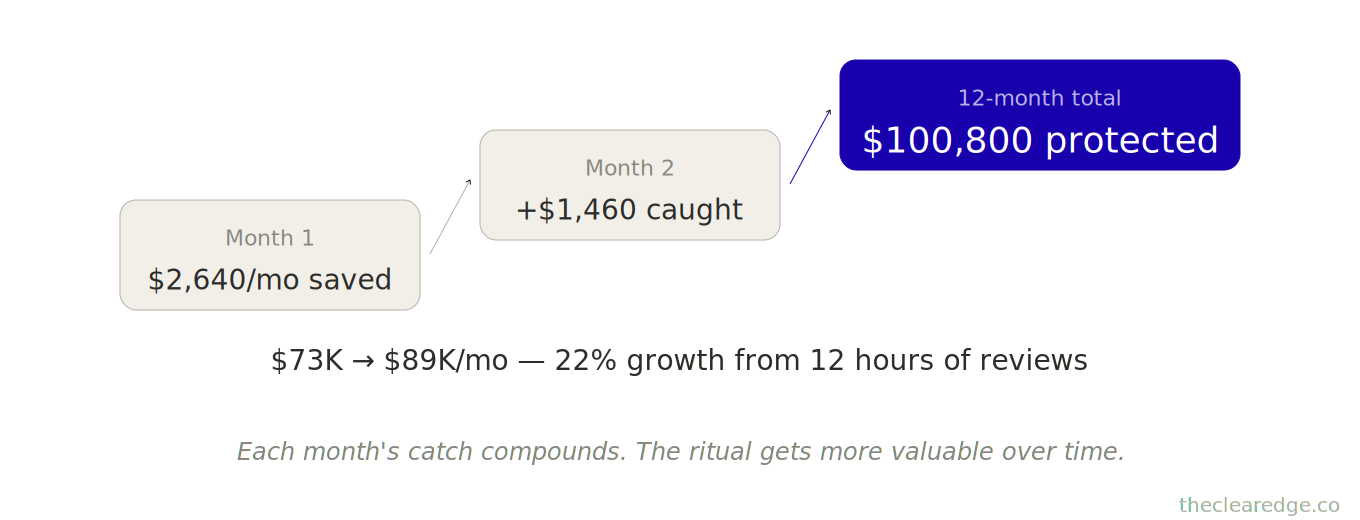
Capacity recovered: $2,640/month → $31,680/yearly
ROI: a $50 investment protects $31,680/year — a 633x return, caught in month 1 only because of the systematic review.
Move 2: Month 2 — Track Variance + Catch Silent Drift
February, first Friday: Second monthly review.
Two flags: margin dropped 2%, CAC increased 10.5%.
Investigation
Margin: payment processor fee changed.
$73K × 2% = $1,460 monthly.
$1,460 × 12 months = $17,520 yearly if not addressed.
CAC: Facebook ad costs increased 15% at the same conversion rate.
Actions
Negotiated a lower payment processing rate (recovered 1.2%).
Paused Facebook ads and doubled organic content (CAC back to $95).
Fixed within 7 days of detection.
If this leak were caught in month 12 instead of month 2, the cost would be $17,520 vs. $2,920 (2 months of leak) — a 6x difference.
That’s the value: monthly reviews catch drift before it compounds.
Move 3: Month 3-12 — Systematic Prevention + Optimization
March through December: monthly reviews every first Friday.
Over 10 months, caught:
3 margin leaks (avg $1,200 monthly each)
2 CAC spikes (avg $800 monthly waste each)
4 efficiency drops (avg 6 hours monthly each)
1 pricing gap (tier underpriced $150 per client)
Total caught early: $8,400/month in preventable issues.
Annual value: $100,800 from just 12 hours of systematic reviews a year.
Revenue trajectory: $73K → $89K over 12 months (22% growth).
She told me: “The monthly review is the single best hour I spend. Everything else is guessing. This is math.”
You see the same pattern across operators who install this ritual.
A consultant at $91K/month skipped his April review (travel, didn’t reschedule).
May review: margin at 26% (baseline 30%) — 4-point drop.
Leak started in April:
New software ($600/month),
Contract labor increase ($800/month)
Shipping up ($200/month).
Total: $1,600/month undetected for 2 months, $3,200 gone.
His words: “Skipping one month cost me $3,200. I’ll never skip again.”
An agency owner at $118K/month runs this every first Friday. Never misses.
Over 24 months she’s caught $247,000 in preventable degradation.
Average monthly leak: $10,300.
Average detection time: 1.8 months. Average fix time: 9 days.
Her words: “This isn’t a nice-to-have. It’s infrastructure. Skip it and you’re flying blind.”
That’s the gap between operators who scale and operators who stall: systematic monthly reviews vs. hoping nothing breaks.
Hidden Revenue Leaks You Miss Without A Monthly Revenue Review
Here’s what you can’t see without this monthly ritual.
Leak 1: The Silent Cost Creep
Costs don’t spike. They creep month by month in small increases you barely notice—until the yearly total is too big to ignore.
This connects directly to the constraint identification we cover in The Bottleneck Audit — monthly reviews catch capacity constraints before they compound.
Pattern:
Software: $1,200 → $1,300 → $1,450 → $1,650 over 12 months.
Monthly change: 5–8% (feels normal).
Annual change: 37% (massive).
Math at $100K/month with a 2% cost increase:
Monthly cost: 2% of $100K = $2,000/month
Yearly cost: $2,000 × 12 months = $24,000/year
Detection window:
Caught in month 2 → $4K problem.
Caught in month 12 → $24K problem.
Monthly reviews catch this in months 1–2. Without them, you usually only notice once cash gets tight, around months 9–12.
Leak 2: The Underpricing Trap
Market rates increase 8–12% each year, but your prices stay flat unless you track and adjust them monthly.
This diagnostic makes sure you actually apply the pricing principles from The Revenue Multiplier consistently
What happened:
A coach at $87K/month hadn’t raised rates in 18 months while the market climbed 15%.
A monthly revenue review flagged flat revenue per client, and the investigation revealed an obvious pricing gap.
Result:
She raised rates 12% at renewal: $87K → $97K over 4 months, purely from price.
That was $120K/year left on the table for 18 months — $180K in total opportunity cost — because nothing was tracking it monthly.
Why it matters:
Monthly reviews prevent revenue per client from staying flat for a year while your costs and market rates rise. You see revenue-per-client stagnation quickly, investigate the cause, and adjust rates every quarter instead of waiting a full year to correct the gap.
Leak 3: The Efficiency Degradation
Delivery hours per client drift 10–20% annually without tracking.
Starts at 10 hours per client and quietly drifts to 12 hours (scope creep, no boundaries).
At 8 clients, that extra 2 hours each becomes:
16 hours monthly
192 hours yearly
$9,600–$19,200 in capacity at $50–$100/hour
Monthly reviews catch this in months 2–3 when revenue/hour drops 8–10%. Without them, you only notice when you’re maxed on capacity—usually months 9–12.
Leak 4: The CAC Blindness
Customer acquisition cost quietly increases 15–25% yearly without optimization.
You spend $2,400/month on ads and get 12 clients ($200 CAC)
Next year, you spend $2,800/month and get 11 clients ($255 CAC)
That’s a 27.5% increase in cost per client.
Extra cost per client: $255 − $200 = $55
Extra cost per month: $55 × 12 clients = $660
Extra cost per year: $660 × 12 months = $7,920 for worse results.
Monthly reviews catch this when CAC jumps 8–10% month-over-month, so you can investigate, optimize, and stop the waste before it compounds.
Leak 5: The Capacity Illusion
You think you’re at 70% capacity, but reality is closer to 85%, driven by hidden coordination overhead.
That missing 15% lives in Slack, email, and “quick calls,” and at $100K/month it represents $15K each month—or $180K a year—of invisible constraint.
Monthly reviews track revenue per hour, and when it drops 10–15% you investigate, surface the overhead, and fix it.
A consultant at $104K/month discovered he was spending 12 hours a week in Slack, about 30% of his work time. The monthly review flagged revenue per hour dropping from $130 to $91, a 30% decline.
Slack was the culprit, so he set a hard boundary and capped Slack at 2 hours a day.
That change:
Recovered 10 hours weekly
Which is 40 hours monthly
At his rate, that’s $5,200/month in capacity
Or $62,400/year
Without monthly tracking, this just looks like being “busy” forever.
Across 73 operators running monthly revenue reviews, the average yearly findings:
3.2 margin leaks (avg $1,800/month each) = $69,120/year
2.1 CAC optimizations (avg $600/month each) = $15,120/year
4.3 efficiency gains (avg 8 hours/month each) = $20,640/year at $60/hour
1.4 pricing corrections (avg $2,200/month each) = $36,960/year
Total annual value: $141,840 caught with about 12 hours of reviews a year.
Value per audit hour: $11,820.
That isn’t consulting or guesswork. It’s math catching what would otherwise quietly decay.
Monthly Vs Quarterly And Yearly Revenue Reviews
Here’s the cost difference between monthly reviews and yearly reviews (or never).
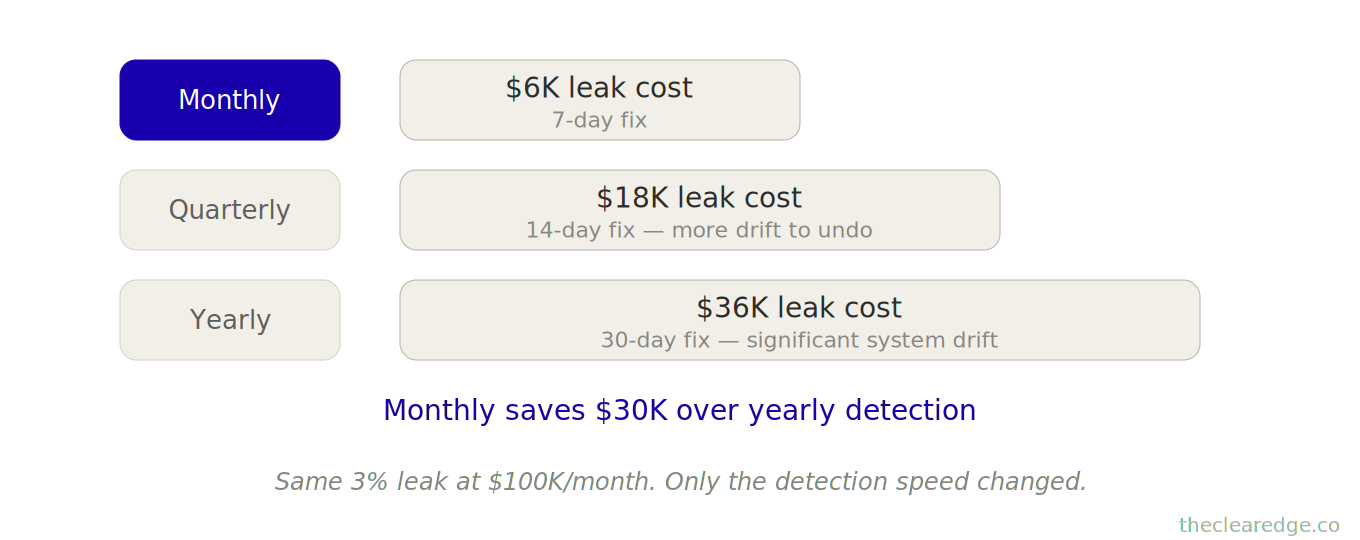
Example: 3% margin leak
Monthly detection (caught in month 2):
Leak duration: 2 months
Monthly cost: $100K × 3% = $3K
Total cost: $6K
Fix time: 7 days
Annual savings from early detection: $30K
Quarterly detection (caught in month 6):
Leak duration: 6 months
Monthly cost: $3K
Total cost: $18K
Fix time: 14 days (more complex, more drift)
Additional cost vs. monthly: $12K
Yearly detection (caught in month 12):
Leak duration: 12 months
Monthly cost: $3K
Total cost: $36K
Fix time: 30 days (significant system drift)
Additional cost vs. monthly: $30K
Never detected:
Leak compounds indefinitely
Year 1: $36K
Year 2: $36K (assuming no growth)
Year 3: $36K
3-year cost: $108K
The math is brutal: monthly detection saves $30K over yearly detection and $102K over never detecting.
A SaaS founder at $96K/month ran yearly reviews only.
Year 1 review found:
Margin at 22% (baseline 28%) — 6‑point leak
CAC at $340 (baseline $220) — 54% increase
Revenue/hour at $75 (baseline $105) — 28% drop
Investigation:
Margin leak started in month 4 → 8 months undetected
$96K × 6% × 8 months = $46,080
CAC spike started in month 6 → 6 months undetected
Extra $120 per client × 12 clients/month × 6 months = $8,640
Efficiency drop started in month 3 → 9 months undetected
30% loss → 12 hours/week over 36 weeks
12 hours/week × 36 weeks = 432 hours
432 hours × $105/hour = $45,360
Total cost of yearly detection vs. monthly: $99,840 in preventable losses.
He switched to monthly reviews in Year 2.
Year 2 results:
8 issues caught (avg detection: month 1.8)
Total leaks found: $8,400/month on average
Total cost of leaks (with early detection): $15,120
Savings vs. Year 1: $84,720
Time investment: 12 hours/year → $7,060 value per hour
His words: “I thought yearly reviews were sufficient. They’re not. They’re expensive. Monthly reviews aren’t optional — they’re the cheapest insurance you’ll ever buy.”
That’s the pattern: monthly reviews cost 12 hours a year; yearly reviews cost $50K–$100K in undetected degradation.
First Friday Monthly Revenue Review Checklist For $80K–$120K Founders
You’ve seen the math, the degradation patterns, and the cost of delayed detection. Here’s how to implement the Monthly Revenue Review starting next month.
Setup (one-time, 30 minutes):
Create a tracking spreadsheet
8 columns (the 8 metrics listed earlier)
12 rows (one per month)
Add formulas for variance calculations
Set your baseline
Use last month’s numbers, or
Use a 3‑month rolling average, or
Use your best month’s numbers
Calendar block first Friday
9:00–10:00 AM (or your preferred hour)
Recurring monthly
Mark as “busy” (non‑negotiable)
Monthly Protocol (60 minutes, every first Friday):
Minutes 1–15: Data collection
Pull the 8 metrics from your accounting/dashboard
Enter them into the tracking sheet
Let the sheet calculate variances automatically
Minutes 16–30: Variance analysis
Review every metric with more than 3% variance
Flag issues
Prioritize them by dollar impact
Minutes 31–45: Root cause investigation
Trace each flagged variance back to its source
Quantify the monthly and yearly cost
Document the finding
Minutes 46–60: Action protocol
Assign one action per root cause
Set a clear timeline (end of week or end of month)
Document the expected impact
The Cost of Skipping:
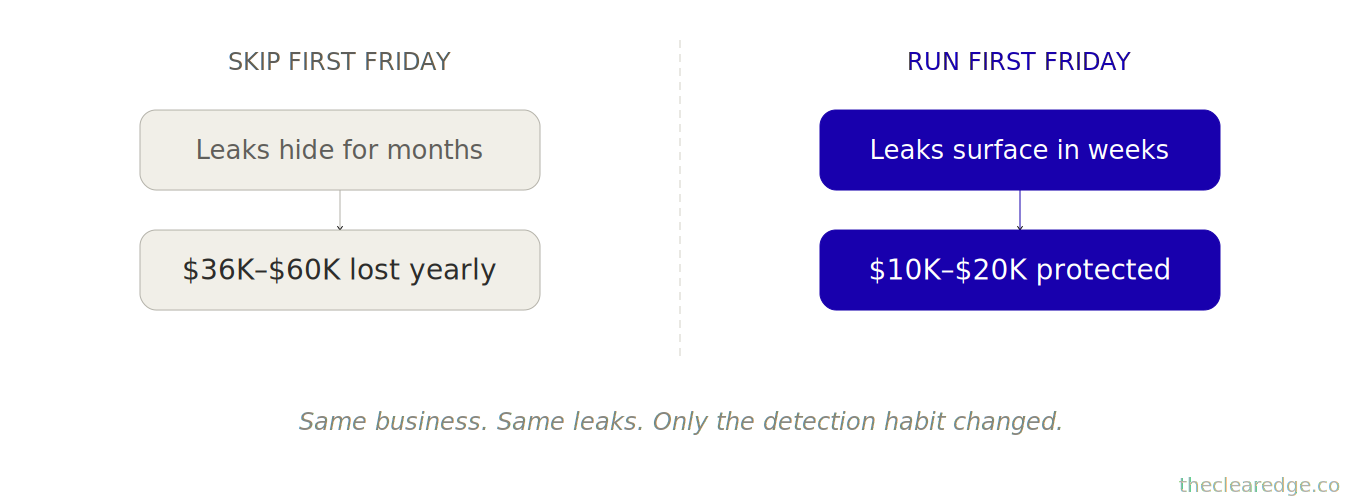
Missing the ritual isn’t neutral. It’s a direct cost:
Skip 1 month: lose $3K–$5K in undetected leaks
Skip 3 months: lose $9K–$15K in compounded degradation
Skip 12 months: lose $36K–$60K in preventable losses
Run 60 minutes monthly: protect $10K–$20K/year at minimum
A consultant at $88K/month skipped four months “because of a launch” and the next review showed a 5‑point margin leak and $17,600 gone that a single First‑Friday session would have capped at $3,520.
When she came back to the ritual:
Margin at 24% (baseline 29%) — 5‑point leak over 4 months
Cost: $88K × 5% × 4 months = $17,600 lost
Root cause: three cost increases, one pricing gap
Fix time: 2 weeks (harder after 4 months of drift)
Had she kept monthly reviews:
Leak detected in month 1
Cost: $3,520 (1 month)
Fix time: 3 days
Savings: $14,080
She told me, “I skipped reviews because I was ‘too busy.’ That cost me $14K, so I’m never too busy for 60 minutes on first Friday again.”
That’s the economics: this isn’t a productivity tactic — it’s revenue insurance.
The Monthly Revenue Review isn’t about working more; it’s about catching what’s silently costing you $10K–$20K each month while you’re busy executing.
Spend 60 minutes on the first Friday of every month.
If you’re at $80K–$120K in monthly revenue, you can’t afford to skip it.
Start next Friday.
The Cost Of “Too Busy”
If you’re “too busy” for 60 minutes of review, you’re volunteering for $20K–$40K in yearly degradation; protect that hour like any high-ticket client slot.
Run the Monthly Revenue Review Field Test Checklist
First Friday of every month, run this 60-minute pass before you trust your $80K–$120K revenue story.
☐ Pulled all 8 core metrics into your sheet and wrote this month’s numbers next to your baseline or 3‑month rolling average.
☐ Calculated variance and flagged any metric shifting more than 3%, then wrote the monthly and yearly dollar cost for each leak.
☐ Traced each flagged metric to a root cause (pricing, cost creep, CAC, efficiency) and wrote one concrete fix with a 7–14 day deadline.
☐ Logged total monthly degradation caught vs. the $10K–$20K leak range so you’re tracking against the $38,400–$141,840 annual protection band.
Sixty disciplined minutes here is what keeps the next $26,100–$135,360 “small leak” from quietly compounding under your $80K–$120K/month headline.
Where to Go From Here: Install Your Monthly Revenue Review and Stop Funding Revenue Leaks
You’re operating at $80K–$120K/month, and every month you skip this 60‑minute review you’re quietly accepting the $10K–$20K revenue degradation tax you just saw in the Priya and operator examples.
From here, treat the Monthly Revenue Review as infrastructure, not a nice‑to‑have:
Block a recurring First Friday, 60-minute slot and lock in your 8‑metric tracking sheet as the single source of truth.
Run the full data → variance → root cause → action sequence every month, fixing each leak within 7–14 days instead of letting it run for 6–18 months.
Use the numbers to decide pricing, hiring, and capacity moves, so each First Friday protects roughly $38,400–$141,840/year instead of waiting for the next $26,100–$135,360 leak to show up in your bank account.
That’s how you turn one 60‑minute block into the best‑paid hour in your business and stop leaving $10K–$20K/month on the table while you’re “too busy” executing.
FAQ About Implementing The Monthly Revenue Review System At $80K–$120K/Month
Q: How do I know if I need the Monthly Revenue Review at $80K–$120K/month?
A: You need it when you’re at $80K–$120K/month, haven’t run a structured 60-minute review in the last 30–60 days, and only dig into numbers when cash feels tight even though your margins, CAC, and revenue-per-client have clearly shifted since your last “big” review.
Q: How much does skipping the Monthly Revenue Review typically cost each year?
A: Skipping this ritual usually costs $10K–$20K per month in margin leaks, underpricing, cost creep, and capacity constraints, which compounds into roughly $39,770–$135,360 over 9–18 months and well over $100K across three years.
Q: How does the Monthly Revenue Review prevent the $26,100 leak in the Priya case?
A: By running a 60-minute First-Friday review that checks margin, CAC, revenue per client, and key costs, Priya would have caught her 5-point margin drop at $87K/month within 1–2 months instead of after 6, turning a $26,100 loss into a roughly $8,700–$13,050 problem fixed in 30 days.
Q: How do I use the Monthly Revenue Review with its 8 metrics before I make the next big pricing or hiring decision?
A: On the first Friday of each month you pull Gross Revenue, Margin %, CAC, Average Transaction Value, Client Count, Revenue per Client, Capacity Utilization, and Revenue per Hour, calculate variance against your baseline, then trace any metric that moved more than 3% to its root cause and assign one concrete action to fix it within 7–14 days before committing to new hires or price changes.
Q: What happens if I rely on quarterly or yearly revenue reviews instead of this 60-minute monthly ritual?
A: Leaks run 6–12 months before you see them, which is how the $67K/month consultant lost $13,400 between months 4–9, the $94K/month coach let an 8-point margin drop burn $135,360 over 18 months, and the $96K/month SaaS founder paid $99,840 for a year of undetected margin, CAC, and efficiency degradation.
Q: How did the $73K/month course creator turn 32 wasted admin hours into $31,680 in recovered capacity using the Monthly Revenue Review?
A: Her first review revealed revenue per hour stuck at $91 instead of the expected $110 and 8 weekly hours on admin, so she implemented scheduling, invoicing, and email automation for $50/month, recovered 24 hours monthly (288 yearly), and converted that into $2,640 monthly—or $31,680 yearly—of additional capacity.
Q: How much time does the Monthly Revenue Review actually take compared to the value it protects?
A: It requires about 30 minutes of one-time setup and then 60 minutes on the first Friday of each month—roughly 12 hours a year—which in the tracked examples has unlocked $38,400–$141,840 in annual savings and created $6,950–$11,820 of value per hour of audit time.
Q: How quickly can I expect to see results after starting the Monthly Revenue Review?
A: Founders who implement it typically catch their first leak—like a 2–4% margin drop, CAC jump, or 8–12% revenue-per-hour decline—in the first or second session, then reverse it within 7–30 days, which is how Priya moved from $87K at 23% margin to a $103K path and the $73K course creator added $74,400 in annual value inside six months.
Q: How does this system interact with The Five Numbers, The Bottleneck Audit, The Revenue Multiplier, and other Clear Edge frameworks?
A: The Five Numbers and related tools establish your baseline economics, while the Monthly Revenue Review turns those numbers into a recurring 60-minute diagnostic that surfaces new bottlenecks, pricing gaps, and margin drifts every month so you can apply The Bottleneck Audit, Revenue Multiplier, and Quarterly Wealth Reset to the most valuable issues instead of guessing.
Q: Why does skipping even one Monthly Revenue Review often cost $3K–$5K at this stage?
A: Because every missed first Friday lets 2–5% leaks in margin, CAC, or efficiency keep running, which is why the $91K/month consultant who skipped April paid an extra $3,200 before noticing a 4% margin drop and the $88K/month founder who skipped four months racked up $17,600 in losses that monthly reviews would have limited to about $3,520.
⚑ Found a Mistake or Broken Flow?
Use this form to flag issues in articles (math, logic, clarity) or problems with the site (broken links, downloads, access). This helps me keep everything accurate and usable. Report a problem →
› More to Explore: Quick Navigation · Monthly Rituals
➜ Help Another Founder, Earn a Free Month
If this system just saved you from losing $39,770–$135,360 to invisible revenue leaks, share it with one founder who needs that relief.
When you refer 2 people using your personal link, you’ll automatically get 1 free month of premium as a thank-you.
Get your personal referral link and see your progress here: Referrals
Get The Monthly Revenue Review Implementation Toolkit
You’ve read the system. Now implement it.
Premium gives you:
Ready-to-use PDF toolkit—every template, diagnostic, and formula pre-filled, zero setup, immediate use
Plug-and-play AI diagnosis sessions—drop into Claude, Gemini or ChatGPT, answer a few questions, save hours of guessing, get your exact next move
Audio key points—concentrated frameworks you can absorb in minutes, implement while you move
Unrestricted access to the complete library—every system, every update
What this prevents: Another $26,100–$135,360 in slow revenue degradation from margin, pricing, and CAC leaks you never see coming.
What this costs: $12/month. Access the diagnostic tools that let you actually run this 60-minute First Friday ritual.
Download everything today. Implement this week. Cancel anytime, keep the downloads.
Already upgraded? Scroll down to download the PDF, audio, and your AI session.
