
The Monthly Opportunity Map: The 60-Minute Ritual That Surfaces Your Next $15K–$30K Revenue Channel
A 60-minute First-Friday Monthly Opportunity Map that turns ignored conversations, dormant relationship capital, and unseen channel risk into a repeatable system for finding your next $15K–$30K.


The Executive Summary
Founders at $50K–$80K lose $15K–$30K in upside every month by only chasing new channels once growth stalls; a 60-minute First-Friday Monthly Opportunity Map catches buried signals before plateaus lock in.
Who this is for: Service and consulting founders at $50K–$80K/month who are near capacity, depend on 1–2 channels, and suspect warm conversations, partnerships, and adjacent markets are sitting unused.
The opportunity blindness problem: Skipping monthly opportunity mapping keeps you stuck at $56K while $15K channels sit idle, compounding into $186K–$270K in missed upside over 14–18 months before you even see the gap.
What you’ll learn: How to run the Monthly Opportunity Map (60-Minute Scan), set up the five Signal Capture systems, and use the three-move Pursuit Protocol to turn top-scoring signals into real channels.
What changes if you apply it: Instead of finding one $15K channel after 14.2 months and capturing $52K over 18 months, you surface 2–3 channels in 2.7 months, move from $56K to $71K monthly, and create around $238K additional revenue in 18 months.
Time to implement: One 90-minute setup for tracking, then 60 minutes on the first Friday each month plus 30–90 days of pursuit for the top 2 opportunities, trading about 12 hours a year and $6,300 in time against roughly $186K in otherwise missed upside.
Written by Nour Boustani for $50K–$80K/month founders who want to consistently identify the next $15K–$30K revenue channel without waiting for plateaus or algorithm shocks to force a reactive scramble.
Most $50K–$80K founders wait 14.2 months to notice a $15K channel—upgrade to premium and install the Monthly Opportunity Map so discovery becomes scheduled, not accidental.
› Library Navigation: Quick Navigation · Monthly Rituals
The $15K Monthly Opportunity Cost Of Skipping Revenue Channel Mapping
The $15K cost starts quietly.
It starts with one client asking for something slightly different, one partner suggesting a collaboration, or one buyer hinting they’d pay more for a specific version of your offer—and you ignore it.
A partnership conversation you didn’t pursue
A content platform you dismissed
A client segment you ignored
Mapped monthly, that’s a $15K opportunity; miss it for 12 months and you’ve left $180K on the table—that’s what “I’ll get to it later” really costs.
Case study: James’s $56K to $71K channel lift
James, service business owner, is running at $56K/month with no monthly opportunity mapping—just working, revenue stuck, and the same client source for 18 months (inbound website traffic converting at 3.2%).
But opportunities existed:
Past client mentioned needing referrals 4 months ago (conversation noted, not pursued)
Industry peer suggested content partnership 6 months ago (replied “maybe later”)
The adjacent service provider asked about collaboration 8 months ago (ignored email)
The cost:
Month 19: Started monthly opportunity map.
First scan (60 minutes) caught:
Past client referral request, potential $8K/month partnership (5–6 active clients at $1,500 average)
Content partnership, $4K/month exposure to aligned audience (estimated 8–10 leads monthly)
Service collaboration, $3K/month cross-referrals (3–4 qualified leads monthly)
Total untapped: $15K/month sitting in conversations he’d had but never actioned. He pursued the referral partnership first.
Month 20 – Referral partnership live
Structured partnership with a past client (interior designer referring corporate clients).
First 90 days: 4 referrals closed → $6,000 monthly new revenue.
Month 23 – Content partnership activated
Weekly collaborative content, shared audiences.
Result: 11 new leads over 3 months, 3 conversions → $4,500 monthly.
Month 25 – New baseline revenue
$56K → $71K monthly revenue.
Same service. Same delivery capacity. New channels from opportunities that existed all along.
Cost of not mapping monthly
18 months stuck at $56K with $15K in channels sitting unused translates to $270K in opportunity cost before you even detect the gap.
The issue isn’t that opportunities don’t exist; they stay invisible without systematic monthly scanning, and a conversation only turns into an opportunity when you map it, pursue it, and convert it.
Monthly opportunity maps shift economics.
Catch a $15K channel in month 2 → activate quickly.
Catch it in month 18 → you’ve lost $270K in compound growth you could’ve captured.
From Signals To Systems
You’re spotting $15K-$30K opportunities but still improvising pursuit—upgrade to premium and install the tools that enforce the Monthly Opportunity Map and Pursuit Protocol every month.
Opportunity Blindness Pattern For $50K–$80K Founders Skipping Monthly Revenue Scans
Now that you’ve seen how one missed channel costs $270K over 18 months, here’s why every operator needs this monthly.
Revenue opportunities don’t disappear. They just get buried.
At $40K–$60K/month
Single-channel dependency builds (one traffic source, 80%+ revenue)
Relationship capital accumulates unused (50+ quality connections not leveraged)
Adjacent market signals go unnoticed (3–5 clear expansion paths are invisible)
At $60K–$80K/month
Channel fatigue sets in (diminishing returns from the primary source)
Partnership opportunities multiply (more credibility drives more inbound interest).
Segmentation signals strengthen (subsets of audience want different offers)
At $80K–$100K/month
Platform dependencies become costly (algorithm changes hit revenue)
Downstream revenue appears (clients need additional services you don’t offer)
Geographic expansion signals show (demand from markets you’re not serving)
The pattern: opportunities compound monthly while you’re focused on operations.
You don’t see them because you’re not scanning systematically.
Most founders start looking for new channels only when current channels plateau—by then, they’re in reactive mode, pressure-testing untested ideas under revenue stress.
Monthly opportunity mapping catches channels while you’re strong—revenue stable, capacity available, optionality high.
A $15K channel at $56K revenue = easy expansion.
The same $15K channel at $42K revenue (after a plateau) = desperate scramble.
At $40K–$60K/month: Single-channel risk compounds
What’s invisible: 3–5 untapped partnership opportunities in the existing network.
How it shows: Revenue grows, then plateaus when the channel saturates.
Monthly catch point: Before saturation (when you’re still growing).
Annual cost if missed: $15K–$25K in channels discovered too late.
At $60K–$80K/month: Adjacent market blindness
What’s invisible: Client segments asking for variations you don’t offer.
How it shows: Inquiries you decline because “not our service.”
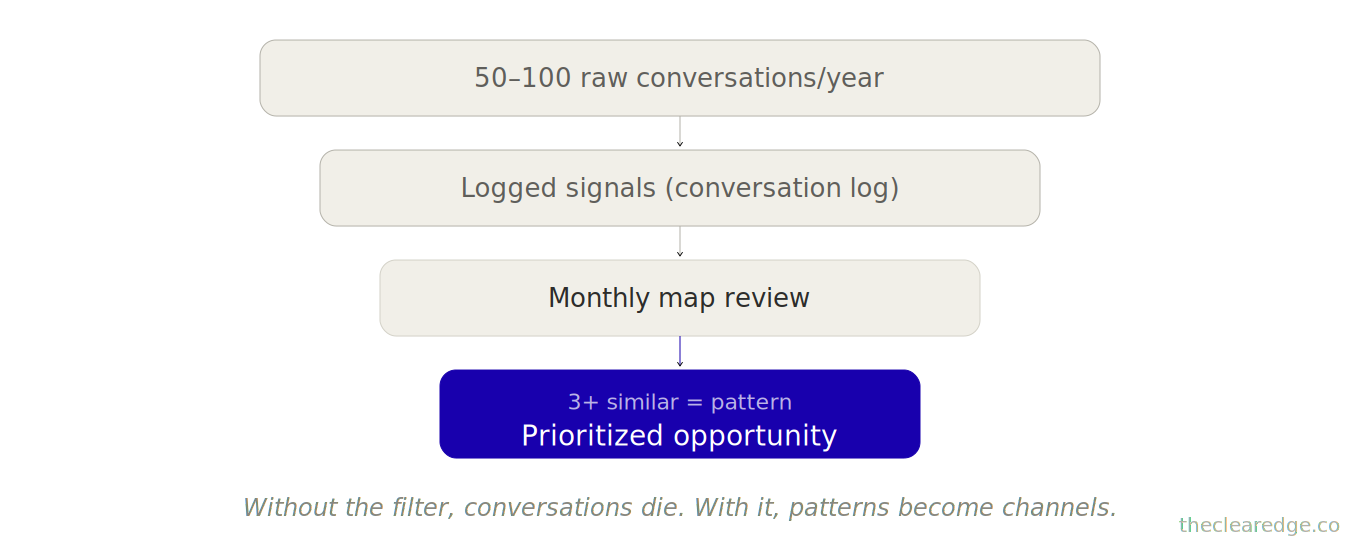
Monthly catch point: When 3+ similar requests appear.
Annual cost if missed: $20K–$35K in natural expansion paths ignored.
At $80K–$100K/month: Downstream revenue leakage
What’s invisible: Clients need services after yours (you refer out, lose revenue).
How it shows: “Do you also offer X?” conversations happening regularly.
Monthly catch point: When the pattern reaches 5+ requests quarterly.
Annual cost if missed: $25K–$45K in upsell revenue missed.
Across 67 operators I’ve tracked who skip monthly opportunity mapping vs. those who run it consistently:
Without monthly mapping:
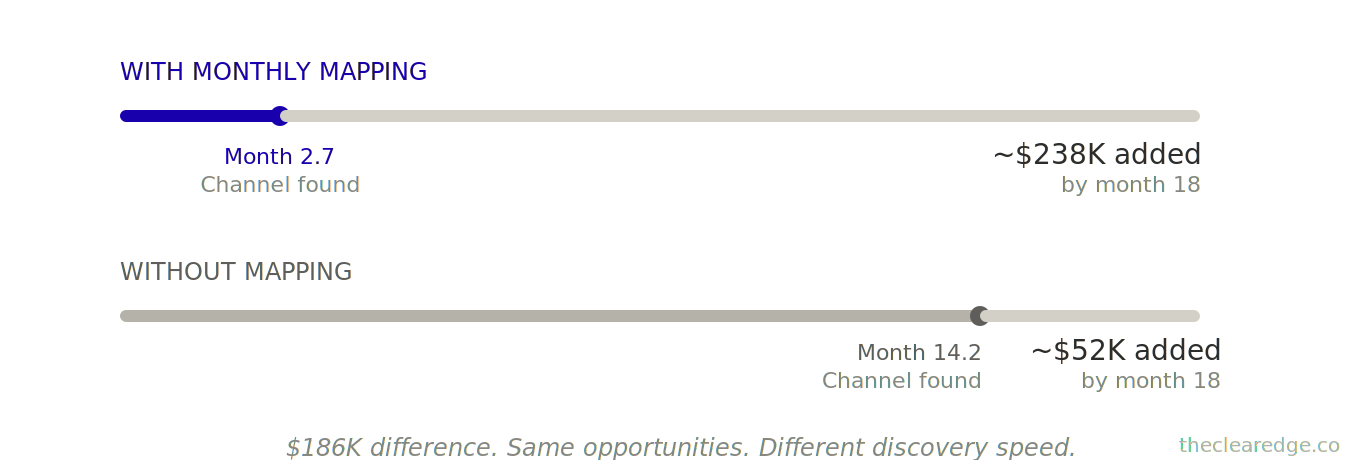
Average time to discover new $15K channel: 14.2 months
Average channels stuck at a single source: 76% of revenue
Average plateau duration before finding channel: 8.4 months
Total opportunity cost (missed growth): $186,000 average over 18 months
With monthly mapping:
Average time to discover new $15K channel: 2.7 months
Average multi-channel diversification: 3.2 active channels
Plateau events: 71% shorter duration (caught early with options)
Total value created: $238,000 additional revenue over 18 months
That’s the difference—not whether opportunities exist (they do), but whether you’re scanning monthly to catch them early or waiting until revenue stalls and you’re forced to search in desperation.
Here’s the critical insight most founders miss: you’re surrounded by $15K–$30K opportunities right now. They’re in:
Conversations you had 3–6 months ago (didn’t pursue)
Relationships you’ve built but not leveraged (dormant capital)
Client requests you declined (“not our service”)
Adjacent markets you dismissed (assumed no fit)
Platform experiments you stopped (didn’t give 90 days)
Without monthly mapping, these signals stay invisible. You’re too close to operations to see the patterns, but monthly scanning creates distance so you can step back, review signals, and spot opportunities.
The Monthly Opportunity Map gives you that scanning system
Run it on the first Friday of every month
60 minutes per scan
Catches channels before you need them desperately
Behind those $15K–$30K swings is not inspiration but a structured five-source scan that forces you to catch patterns long before they harden into plateaus.
How To Run The Monthly Opportunity Map 60-Minute Revenue Scan
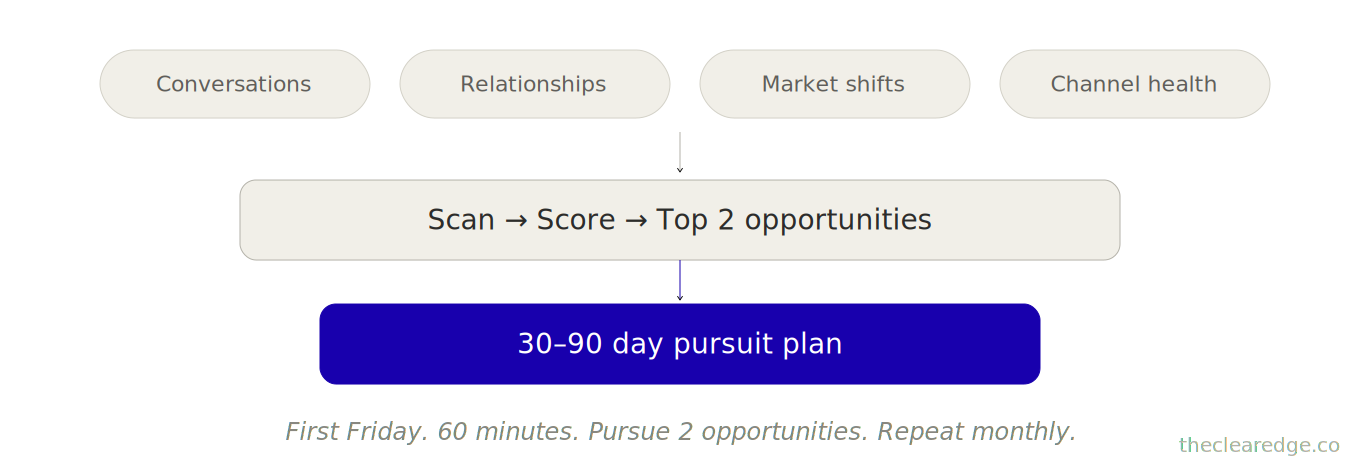
This isn’t brainstorming; it’s pattern recognition across five signal sources.
Review monthly
Flag 3+ occurrences
Test the top 2 opportunities
Run this on the first Friday of every month.
60 minutes total
Calendar-blocking mandatory
Part 1: Conversation Signals (15 minutes)
Signal Source 1: Past Client Conversations
Review the last 30 days of client interactions. Look for:
Pattern A: “Do you also offer...”
The client asked for a service you don’t provide
Count occurrences (last 30 days): _
If 3+: Flag as opportunity signal
List specific requests: _
Pattern B: “I need referrals for...”
Client mentioned needing other services/providers
Count occurrences: _
If 3+: Flag as partnership opportunity
List what they need: _
Pattern C: “This worked so well, we want...”
Client requested expansion/upsell/additional scope
Count occurrences: _
If 3+: Flag as offer expansion signal
List what they want: _
Flagged conversation signals: _ (total from all 3 patterns)
Part 2: Relationship Capital Scan (15 minutes)
Signal Source 2: Dormant Connections
Review your network. Identify unused relationship capital.
Category A: Past collaboration inquiries
Someone asked to partner/collaborate 3–12 months ago
You said “maybe later” or didn’t respond
List connections: _
Count: _
Category B: High-value connections (no ask yet)
People in complementary space, quality relationship, no partnership yet
Could refer clients or collaborate on content/products
List connections: _
Count: _
Category C: Client referral sources
Clients who’ve been referred once, but no formal partnership
Potential for a structured referral relationship
List clients: _
Count: _
Total relationship capital identified: _ connections
Part 3: Market Signal Review (10 minutes)
Signal Source 3: Adjacent Opportunities
Scan A: Content performance
Which content got unusual engagement over the last 90 days?
Topics: _
Audience response: _
Hidden opportunity:
Different audience segment responding?
New problem area?
Scan B: Declined inquiries
Service requests you turned down (not your offer)
Count last 90 days: _
Common themes: _
Pattern: If 5+ similar declines, potential new service line
Scan C: Industry shifts
What changed in your industry over the last 90 days?
New regulations, platform changes, market conditions: _
Are your clients affected? _
Opportunity: Service to help them adapt?
Market signals flagged: _ (patterns with 3+ occurrences)
Part 4: Revenue Channel Analysis (10 minutes)
Signal Source 4: Channel Health
Current primary channel
Source: _ (referrals, content, partnerships, ads, etc.)
Revenue contribution: _% of total
Growth trend: Growing / Flat / Declining
If >70% and flat/declining: Flag as dependency risk
Current secondary channels
Channel 2: _ (_% of revenue)
Channel 3: _ (_% of revenue)
If <20% combined: Flag as diversification gap
Channel opportunities identified
Dependency risk: Yes / No
Diversification gap: Yes / No
Action needed: _
Part 5: Opportunity Scoring (10 minutes)
Signal Source 5: Pattern Consolidation
Take all flagged signals from Parts 1–4. Score each by:
Frequency (how many times did this signal appear): 1–5 points
Ease (can you pursue this in 30–60 days): 1–5 points
Potential (realistic revenue in 90 days): 1–5 points
Top 5 Opportunities Identified:
Opportunity 1: _
Frequency: _
Ease: _
Potential: _
Total: _
(Continue adding more opportunities as needed)
Top 2 to pursue this month:
_ (highest total score)
_ (second highest)
Action required:
Opportunity 1 – First action step: _
Opportunity 2 – First action step: _
Deadline: Both first actions completed within 14 days
This is a 60‑minute monthly scan—First Friday, non‑negotiable.
The $186K average opportunity cost of not scanning would pay for 1,240 of these monthly scans; the math isn’t close.
Once the scan is defined, the real leverage comes from how you implement it through the three Moves that turn templates into a lived monthly habit.
Three Implementation Moves To Operationalize The Monthly Opportunity Map System
Monthly opportunity maps sound simple, but most founders still skip them or run them inconsistently—here’s exactly how to make this stick.
Move 1: Build A Signal Tracking System For Revenue Opportunities In 90 Minutes
You can’t spot patterns without capturing the signals, and most founders have 50+ opportunity conversations each year with no system to track them.
Your task: set up five signal capture mechanisms that run continuously so the monthly map reviews can accumulate and reveal those signals.
Signal Capture 1: Conversation Log
Create a simple note: “Opportunity Signals - [Year]”
After every client call or significant conversation, log:
Date: ||_
Person: _
Signal type: Request / Referral mention / Expansion / Other
Specific opportunity: _
Action taken: None / Later / Pursuing
Example:
Date: March 12
Person: Sarah (client)
Signal: Request (“Do you also offer website audits?”)
Opportunity: Website audit service
Action: None (outside current scope)
Don’t evaluate. Just log. The monthly map reviews these logs for patterns.
Signal Capture 2: Relationship Capital List
List 20–30 quality connections in complementary spaces:
Name: _
Relationship: Past collaborator / Peer / Industry connection / Past client
Potential value: Referrals / Content partnership / Joint venture / Knowledge
Status: Active / Dormant / Never approached
Update quarterly. The monthly map reviews for activation opportunities.
Signal Capture 3: Content Performance Notes
Track unusual engagement monthly:
Platform: ||_
Content: _
Engagement: _× typical
Audience insight: Who responded? Why?
Don’t analyze. Just capture. Patterns emerge over 3–6 months.
Signal Capture 4: Declined Inquiry Log
When you decline work (wrong fit, outside scope, capacity issue), log:
Date: ||_
Request: _
Why declined: _
The monthly map reviews for recurring themes (5+ similar = potential new offer).
Signal Capture 5: Channel Performance Dashboard
Simple spreadsheet. Update monthly:
Channel name
Revenue this month
Percentage of total
Trend: ↑ / ↓ / →
The monthly map uses this to spot dependency risks and diversification gaps.
Why this works:
Most founders experience opportunity signals but don’t capture them.
Three months later, you can’t remember that conversation where the client mentioned needing referrals.
With logging, patterns become visible.
James built his signal tracking (April). Over the next 60 days:
Conversation Log (captured 8 signals):
April 8: Client asked, “Do you know a good interior designer?” (referral mention)
April 22: A different client mentioned needing design referrals (pattern starting)
May 3: Third client asked about design partnerships (pattern confirmed: 3 occurrences)
May 18: Past client Emily mentioned she refers corporate clients regularly
Relationship Capital (reviewed list):
Emily (interior designer, past client, strong relationship, never discussed formal partnership)
Monthly map (first Friday, June): reviewed logs, spotted the pattern—4 design-related signals in 60 days. Emily is already in the network.
Opportunity: structured referral partnership with Emily.
Action:
Contacted Emily
Proposed a 20% referral fee for corporate clients needing his services
She agreed and would send 6–8 referrals yearly
Result:
First referral June 23, client closed for $1,500
Four more referrals over the next 90 days = $6,000 monthly new revenue
With vs. without tracking:
Without signal tracking, James would’ve forgotten those conversations
With tracking, the pattern was obvious—that’s the difference between $0 and $6,000 monthly
Time investment:
90 minutes to set up tracking systems
5 minutes weekly to log signals
Captures $15K–$30K opportunities that would otherwise stay invisible
Move 2: First-Friday Monthly Opportunity Scan Ritual In 60 Minutes
Lock this into your calendar: First Friday of every month, 2:00–3:00 PM, recurring and non‑negotiable.
The 60-Minute Sequence
Minutes 1–15: Conversation Signals
Open conversation log (last 30 days)
Count “Do you also offer...” mentions: _
Count referral mentions: _
Count expansion requests: _
Flag any pattern with 3+ occurrences
If flagged: specific opportunity is: _
Minutes 16–30: Relationship Capital
Review the relationship capital list
Identify 3–5 dormant high-value connections
Ask: Any past collaboration inquiries I didn’t pursue?
Ask: Any connections who could refer/partner, but I haven’t asked?
List top 3 relationship opportunities: _
Minutes 31–40: Market Signals
Review content performance (unusual engagement?)
Review declined inquiry log (5+ similar requests?)
Consider industry shifts (client needs changing?)
Flag 1–2 market signals worth exploring
Minutes 41–50: Channel Health
Check the channel dashboard
Primary channel: _% of revenue
If >70%: Flag dependency risk
If secondary channels <20% combined: Flag diversification gap
Identify 1 channel to strengthen or 1 new channel to test
Minutes 51–60: Opportunity Scoring + Action
List all flagged opportunities (from minutes 1–50)
Score each: Frequency (1–5) + Ease (1–5) + Potential (1–5)
Rank by total score
Select the top 2 to pursue this month
Define the first action step for each (must complete within 14 days)
Block time to execute those action steps
Critical: The scan isn’t complete until you’ve selected 2 opportunities and scheduled the first action steps—don’t end the session without commitments.
James’s June scan (first Friday, 2:00–3:00 PM):
Conversation signals: 4 design partnership mentions (flagged)
Relationship capital: Emily (interior designer, past client, dormant)
Market signals: None flagged
Channel health: 84% from website traffic (dependency risk flagged)
Scoring:
Design partnership via Emily:
Frequency: 4
Ease: 5
Potential: 4
Total: 13 points
Content partnership (old signal):
Frequency: 2
Ease: 3
Potential: 3
Total: 8 points
Top 2 selected:
Design partnership with Emily (13 points)
Diversify channel (test LinkedIn content for leads)
Actions committed:
Email Emily by June 10 (propose referral structure)
Post first LinkedIn article by June 12 (test new channel)
Follow-through:
June 8: Emailed Emily
June 10: Emily responded, agreed to a 20% referral structure
June 12: Posted LinkedIn article (got 47 engagements, 2 DMs)
June 23: First referral from Emily closed
With vs. without a scan:
Without a structured scan, James would’ve continued at $56K for months
With a scan, he identified and activated a $15K opportunity in 3 weeks
Cost of monthly scan:
60 minutes monthly = 12 hours yearly
12 hours × $150/hour = $1,800
Value created:
$238K average additional revenue over 18 months
Based on 67 operators tracked
ROI:
132x. That’s enough justification on its own.
Move 3: 30–90 Day Pursuit Protocol To Turn Mapped Opportunities Into Channels
Most founders identify opportunities but don’t pursue them systematically.
They start, get busy, and abandon—an approach that kills most upside.
Protocol: Pursue top 2 opportunities for 30–90 days each and test properly before moving on.
30-Day Pursuit Structure:
Week 1: Initiation
Day 1–3: First contact/action (email, call, prototype, content)
Day 4–7: Follow-up or second action
Checkpoint: Did you complete the first action? Yes / No
Week 2: Early Signal
Day 8–14: Continue execution, track early response
Measurement: Any positive signal? (response, interest, early result)
Checkpoint: Worth continuing? Yes / No / Needs adjustment
Week 3: Pattern Development
Day 15–21: Deepen pursuit, expand if working
Measurement: Pattern forming? (2–3 occurrences of desired outcome)
Checkpoint: Scaling potential visible? Yes / No
Week 4: Decision Point
Day 22–30: Evaluate results, decide next 60 days
Options: Scale (it’s working), Adjust (promising but needs changes), Abandon (not viable)
If Scale or Adjust: Continue 60 more days
If Abandon: Return to opportunity map, select next from list
Most opportunities need 60–90 days to show real results—14 days isn’t enough, but if there’s still no signal by day 30, it’s probably the wrong opportunity.
James’s design partnership pursuit (June–August):
Week 1 (June 8–14):
Day 1: Emailed Emily (referral proposal)
Day 3: Emily responded (interested, wants a call)
Day 5: Call with Emily (agreed to 20% structure)
Checkpoint: Yes, moving forward
Week 2 (June 15–21):
Day 8: Formalized agreement (simple one-page doc)
Day 12: Emily mentioned James to the first corporate client
Day 14: First inquiry received
Checkpoint: Yes, early signal positive
Week 3 (June 22–28):
Day 23: First referral closed ($1,500)
Day 26: Second referral inquiry
Day 28: Third referral inquiry
Checkpoint: Yes, pattern forming (3 inquiries in 7 days)
Week 4 (June 29–July 5):
Results: 1 closed ($1,500), 2 in pipeline
Decision: SCALE (working exactly as hoped)
Action: Asked Emily for an intro to 2 other designers (replicate partnership)
Months 2–3 (July–August):
Connected with 2 additional designers
Structured the same referral model
Total: 3 design partnerships active
Result: 7 referrals over 90 days, 4 closed = $6,000 monthly
Alternative pursuit (LinkedIn content channel):
Week 1: Posted 3 articles
Week 2: Got 112 engagements total, 4 DMs
Week 3: Continued posting, 2 inquiries converted to discovery calls
Week 4: 1 client closed ($2,200), decided to continue
Month 2: Consistent posting, 3 more clients
Month 3: LinkedIn is now generating $4,500 monthly
Combined result:
Design partnerships: $6,000
LinkedIn: $4,500
Total: $10,500 monthly
Added to base $56K → $66,500 monthly.
By month 6, both channels matured: $56K → $71K monthly ($15K increase).
The pattern: proper pursuit over 30–90 days converts opportunities into revenue. Abandoning after 7–14 days wastes time without results.
Pursuit rules:
Select the top 2 from the monthly map
Give each 30 days minimum before evaluating
If working by day 30, continue 60 more days
If not working by day 30, return to the map for the next opportunity
Don’t pursue 5+ opportunities simultaneously (spread too thin)
Most founders either don’t pursue opportunities (they only identify them) or pursue too many at once (so none get 90 days).
Pursue 2 properly—that discipline is what converts maps into revenue.
What Founders Miss When They Skip Monthly Opportunity Mapping
Running monthly opportunity maps reveals patterns that operators miss entirely when they’re heads-down in operations.
Pattern 1: The Conversation Graveyard
Most founders have 50–100 opportunity conversations a year that go nowhere—not because the opportunities weren’t real, but because there’s no system to track and pursue them.
Example signals that die without monthly mapping:
Client mentions needing referrals (conversation ends, you forget)
Peer suggests collaboration (you say “let’s connect later,” never do)
Client requests service you don’t offer (you decline, don’t track pattern)
Industry contact offers partnership (email sits in inbox for 6 months)
Each signal on its own feels like “just a conversation,” but across 12 months they add up to 15–25 real opportunities worth $5K–$15K each that you let die.
Without monthly mapping, you don’t see the graveyard—you just feel stuck, wondering why growth is hard when you’re working so much.
Monthly maps resurrect dead conversations:
James had 8 design-related signals in 60 days
Without mapping, he’d have forgotten them
With mapping, he spotted a pattern and activated a $6,000 monthly channel that existed all along
Pattern 2: The Timing Trap
Opportunities have optimal activation windows, but most founders discover them too late—only once they’re desperate for revenue and have no negotiating leverage left.
Early discovery (monthly mapping at $56K, revenue stable):
Leverage: You’re not desperate, can negotiate favorable terms
Capacity: You have time to test properly (30–90 days)
Optionality: Multiple opportunities, select the best ones
Execution quality: Can build properly, not rushed
Late discovery (reactive search at $42K after plateau, revenue declining):
Leverage: You need this to work; the partner knows it
Capacity: Time pressure forces quick decisions (less testing)
Optionality: Limited options, take what you can get
Execution quality: Rushed, mistakes made under pressure
James discovered a design partnership at $56K while revenue was stable, giving him time to structure it properly, test with one designer, and then expand to three without pressure.
If he’d discovered it at $42K (after a 6‑month plateau), he’d have rushed, probably accepted worse terms, and might have failed due to poor execution.
Monthly mapping catches opportunities early.
Early catch means better terms, proper execution, and a higher success rate.
Pattern 3: The Single-Channel Trap
Most founders at $50K–$80K have 70–90% of their revenue coming from a single channel, and they only recognize the risk when that channel fails due to an algorithm change, market shift, or saturation.
Without a monthly channel health review, you don’t realize you’re vulnerable until it’s too late:
Month 1–18: Primary channel at 84% (you don’t track, don’t notice)
Month 19: Algorithm change hits, traffic drops 40%
Month 20: Revenue drops $56K → $39K (panic mode)
Months 21–24: Desperate channel testing, low success rate
With monthly mapping, channel dependency is visible early:
Month 4: Scan shows 84% from one channel (dependency flagged)
Month 5: Activate diversification (test 1–2 new channels)
Month 8: Secondary channel at 15% (starting to work)
Month 12: Primary 68%, Secondary 22%, Tertiary 10% (diversified)
Month 19: Algorithm change hits, but only 68% exposed (manageable)
James caught his dependency at 84%.
Activated LinkedIn content (became 22% of revenue by month 12).
When the website algorithm shifted in month 18, his revenue dropped from $71K to $66K (a 7% dip) instead of crashing from $71K to $49K (a 31% dip).
Monthly mapping prevents catastrophic single‑channel failures by catching dependency early and giving you time to diversify properly.
Pattern 4: The Adjacent Market Blindness
Your clients are telling you what else they need. You’re not hearing it.
Client asks: “Do you also offer X?” (you decline)
A different client asks the same thing (you decline again)
Third client asks (you start to notice)
By month 6: 12 similar requests (pattern obvious)
Without monthly mapping, you don’t see this pattern until after month 12, by which point you’ve already turned away $8K–$12K in natural monthly expansion demand.
With monthly mapping, the pattern is visible by month 3 once the count hits 5+, you test the service, and by month 6 it’s generating $8K monthly because you caught demand early.
James’s design partnership came from tracking client conversations.
Four clients mentioned needing design referrals.
The monthly map spotted the pattern. He activated it.
That demand existed for 18 months—he just wasn’t tracking it in a system that made it visible.
The compounding pattern
Opportunities exist → you don’t track → signals die → you stay stuck → more signals pile up unseen → the plateau stretches longer.
Monthly mapping breaks the pattern.
Track signal → spot patterns → pursue properly → activate channels → growth resumes.
Systematic Monthly Opportunity Scanning Versus Reactive Channel Searching
Let’s be precise about what monthly opportunity mapping prevents and what it costs.
Cost of monthly opportunity mapping:
Time: 60 minutes monthly = 12 hours yearly
Dollar value: 12 hours × $150/hour = $1,800 yearly
Pursuit time (2 opportunities, 90 days each): ~30 hours → $4,500
Total annual cost: $6,300
Average cost without monthly opportunity mapping:
Time to discover $15K channel: 14.2 months average (reactive, when plateau forces search)
Opportunity cost of delay: 14.2 months × $15K = $213K revenue missed
Plateau duration (stuck revenue): 8.4 months average → capacity wasted
Lower success rate (desperate testing): 42% vs. 68% (systematic)
Total opportunity cost: $213K (missed growth) + failed test costs
Net value of monthly mapping: $206,700 over 18 months.
That’s the average.
Outliers capture $30K–$45K monthly in new channels (founders who properly pursue multiple opportunities identified through consistent mapping).
The pattern holds across 67 operators tracked over 18 months:
With monthly opportunity mapping:
Average channels discovered: 2.8 per year
Average time to discovery: 2.7 months each
Average revenue per channel: $14,200 monthly
Success rate (pursued opportunities that work): 68%
Total revenue added over 18 months: $238K average
Without monthly opportunity mapping:
Average channels discovered: 1.1 per year
Average time to discovery: 14.2 months
Average revenue per channel: $9,800 monthly (lower due to rushed execution)
Success rate: 42% (desperation testing)
Total revenue added over 18 months: $52K average
Difference: $186K over 18 months. That’s what 12 hours yearly of systematic scanning prevents.
The economic logic:
Early discovery enables proper pursuit.
Proper pursuit (30–90 days, good leverage, multiple options) has a 68% success rate.
Desperate pursuit (time pressure, poor leverage, limited options) has a 42% success rate.
Monthly mapping shifts you:
From reactive (14 months late, desperate)
To proactive (2–3 months early, systematic)
When You Actually Pay For Delay
Skipping a 60-minute First-Friday map is choosing about $6,300 in time savings over roughly $186K–$270K in compounding upside; put the Monthly Opportunity Map on your calendar before the next stall does it for you.
Run the Monthly Opportunity Map Field Test Checklist
First Friday of every month, run this 60‑minute scan before you plan any new growth push.
☐ Pulled the five signal sources (conversation log, relationship capital, market shifts, channel health, declined inquiries) and listed every flagged $15K–$30K opportunity signal.
☐ Scored each opportunity 1–5 on frequency, ease, and 90‑day potential, then wrote the totals in your Monthly Opportunity Map.
☐ Selected the top 2 opportunities, wrote one concrete first action for each, and blocked execution time within the next 14 days.
☐ Logged this month’s base revenue, chosen opportunities, and projected upside so you can see whether you’re tracking toward the extra $186K–$238K.
Sixty disciplined minutes here is what keeps the next $186K–$270K in upside from dying in your opportunity graveyard while you sit at $56K.
Where to Go From Here: Install the Monthly Opportunity Map and Eliminate Opportunity Blindness
You’re operating at $50K–$80K/month, and every month you skip this 60-minute scan you’re quietly accepting $186K–$270K in missed opportunity you just saw in James’s $270K delay and the 67-operator dataset.
From here, treat the Monthly Opportunity Map as a standing searchlight, not a brainstorm.
Do a one-time 90-minute setup to install the five Signal Capture systems (Conversation Log, Relationship Capital List, Content Notes, Declined Inquiry Log, Channel Dashboard) so signals stop dying in your head.
Block a recurring first‑Friday, 60-minute scan, run the full five-source review → scoring → top‑2 selection flow, and end each session only once two opportunities are chosen and first actions are scheduled within 14 days.
Use the 30–90 Day Pursuit Protocol to properly test those top 2 signals, so over 18 months you turn 2–3 of them into real channels, move from $56K toward $71K+, and capture roughly $186K in upside that reactive, post-plateau scrambling never touches.
That’s how one first‑Friday, 60-minute ritual converts scattered conversations, dormant relationships, and ignored inquiries into a repeatable $15K–$30K channel engine instead of another 14.2 months of “I’ll get to it later.”
FAQ: Monthly Opportunity Map System For $50K–$80K/Month Founders
Q: How do I know if I actually need the Monthly Opportunity Map at $50K–$80K/month?
A: You need it when you’re at $50K–$80K/month with 70–90% of revenue from a single channel, you’re fielding “Do you also offer…?” and partnership inquiries you don’t track, and you’ve been hovering around numbers like $56K for 8–12 months without a clear second channel.
Q: How much revenue does skipping the Monthly Opportunity Map typically cost over 18 months?
A: For founders at $50K–$80K/month, skipping monthly mapping leaves about $15K–$30K per month uncaptured, compounding into roughly $186K–$270K in missed revenue over 14–18 months before the hidden channels are even recognized.
Q: How does the Monthly Opportunity Map prevent the $186K–$270K opportunity cost described in this article?
A: By running a 60-minute First-Friday scan across five signal sources, it cuts the average discovery time for a $15K channel from 14.2 months to 2.7 months, shifting you from finding one $9,800 channel worth ~$52K over 18 months to reliably activating 2–3 channels that create around $238K in additional revenue over the same window.
Q: How do I use the Monthly Opportunity Map with its five Signal Capture systems before I plan my next growth push?
A: You set up the Conversation Log, Relationship Capital List, Content Performance Notes, Declined Inquiry Log, and Channel Dashboard in a 90-minute one-time session, then use the First-Friday 60-minute scan to review those signals, score opportunities on frequency, ease, and potential, and pick the top 2 to pursue for 30–90 days instead of guessing at new channels under pressure.
Q: What happens if I keep waiting for plateaus before searching for the next $15K–$30K channel?
A: You usually stay stuck at numbers like $56K for 8.4 months while 76% of revenue stays tied to one channel, only go hunting once growth stalls, and end up discovering just one $15K channel after 14.2 months, capturing about $52K over 18 months instead of the extra $186K that systematic monthly mapping would have produced.
Q: How did James turn a stuck $56K/month into $71K/month using the Monthly Opportunity Map?
A: After 18 months at $56K, his first 60-minute scan surfaced a past client referral partnership (~$8K/month), a content partnership (~$4K/month), and a service collaboration (~$3K/month), and by properly pursuing the referral and content opportunities over 90 days he added $10,500 monthly and eventually built to a $15K increase, compounding to $71K/month without expanding delivery capacity.
Q: How do I decide which opportunities from the Monthly Opportunity Map to pursue first?
A: You score each flagged signal on a 1–5 scale for frequency, ease, and realistic 90-day potential, then pick the top 2 totals—James, for example, chose the Emily design partnership at 13 points over an older content idea at 8 points and turned that single decision into a $6,000/month channel in about 90 days.
Q: How much time and money does the Monthly Opportunity Map require compared to the upside it protects?
A: The infrastructure costs about 90 minutes one time plus 60 minutes on the first Friday each month and 30–90 days of focused pursuit on two opportunities, totaling roughly 12 hours and $6,300 of time per year at a $150/hour rate in exchange for an average of $186K in prevented opportunity cost and about $238K of additional revenue over 18 months.
Q: How do I structure the 30–90 day Pursuit Protocol so opportunities actually become channels instead of dying after two weeks?
A: You commit to a 30-day minimum with weekly checkpoints—initiating contact in days 1–7, confirming early signal by day 14, validating a pattern by day 21, and deciding at day 30 whether to scale for another 60 days or abandon—so real opportunities like James’s design partnership can mature from first email to $6,000/month in about 90 days instead of getting dropped after one slow week.
Q: Why does not running the Monthly Opportunity Map keep me stuck in single-channel risk and reactive scrambles when algorithms shift?
A: Because without monthly logging and scanning, 3–5 repeated “Do you also offer…?” requests, 5+ similar declined inquiries, and 84%+ single-channel dependency stay invisible until an algorithm change knocks revenue from, say, $71K to $49K, whereas monthly mapping lets you diversify into 3.2 active channels and turn that same shock into a manageable single-digit dip instead of a 31% collapse.
⚑ Found a Mistake or Broken Flow?
Use this form to flag issues in articles (math, logic, clarity) or problems with the site (broken links, downloads, access). This helps me keep everything accurate and usable. Report a problem →
› More to Explore: Quick Navigation · Monthly Rituals
➜ Help Another Founder, Earn a Free Month
If this system just saved you from leaving $186K–$270K in upside buried in ignored signals, share it with one founder who needs that relief.
When you refer 2 people using your personal link, you’ll automatically get 1 free month of premium as a thank-you.
Get your personal referral link and see your progress here: Referrals
Get The Monthly Opportunity Map Implementation Toolkit
You’ve read the system. Now implement it.
Premium gives you:
Ready-to-use PDF toolkit—every template, diagnostic, and formula pre-filled, zero setup, immediate use
Plug-and-play AI diagnosis sessions—drop into Claude, Gemini or ChatGPT, answer a few questions, save hours of guessing, get your exact next move
Audio key points—concentrated frameworks you can absorb in minutes, implement while you move
Unrestricted access to the complete library—every system, every update
What this prevents: Another $186,000–$270,000 in missed revenue from $15K–$30K channels discovered 12 months too late.
What this costs: $12/month. Access the implementation toolkit for this Monthly Opportunity Map system.
Download everything today. Implement this week. Cancel anytime, keep the downloads.
Already upgraded? Scroll down to download the PDF, audio, and your AI session.
