
The Monthly Efficiency Upgrade: The 60-Minute Ritual That Turns 3% Monthly Gains Into $14K–$21K in Annual Profit
For course creators, coaches, and service founders at $80K–$120K/month who want 15–20% annual growth from 3% monthly upgrades in 60 minutes without adding hours.


The Executive Summary
Founders at $80K–$120K lose $14K–$21K in annual upside by chasing rare 30% breakthroughs instead of running a 60-minute First-Friday ritual that compounds routine 3% efficiency upgrades.
Who this is for: Course creators, coaches, and service founders at $80K–$120K/month who feel plateaued, don’t run a monthly efficiency review, and are drained by constant 30% “big swing” pivots.
The efficiency upgrade problem: Skipping monthly 3% upgrades leaves roughly $168K in compound gains uncaptured, caps growth near 8.2% annually, and burns 160–240 hours on big projects that only work 23% of the time.
What you’ll learn: How to run the Monthly Efficiency Upgrade (60-Minute Hunt) using five scans—Revenue Efficiency, Process Efficiency, Conversion Efficiency, Resource Allocation, and System Friction—and log each win in an Efficiency History Log.
What changes if you apply it: You stop gambling 200+ hours on rare breakthroughs and instead stack 6–8 successful 3% upgrades yearly, moving from $94K to $108K monthly ($14K lift, 14.9% growth) with compounding improvements.
Time to implement: The infrastructure takes 90 minutes once, then 60 minutes on the first Friday each month plus 3–5 hours to implement that month’s upgrade, with visible shifts inside 30 days and full compounding over 6–12 months.
Written by Nour Boustani for $80K–$120K/month founders who want to turn 3% monthly efficiency upgrades into $14K–$21K in annual profit without adding hours or chasing exhausting 30% “breakthrough” projects.
Every month without a 60-minute First‑Friday scan risks another $14K–$21K in unrealized compounding—upgrade to premium and run the full Monthly Efficiency Upgrade protocol.
› Library Navigation: Quick Navigation · Monthly Rituals
The $14K Cost of Skipping Monthly 3% Efficiency Upgrades
Big swings, inconsistent results, exhaustion from constant pivots—that was Kai’s pattern at $94K/month before he installed a monthly efficiency system.
He’d rebuilt the entire course, migrated platforms, and tried full marketing overhauls. Revenue still felt stuck. The effort was massive; the compounding was missing.
The gap wasn’t ambition. It was the absence of a structured way to capture 3% improvements every month and let them stack. Without that, you’re gambling on breakthroughs instead of banking small wins.
In Month 7, Kai started running monthly efficiency upgrades with the Monthly Efficiency Upgrade—a 60-minute First-Friday hunt for one concrete 3% gain anywhere in the business.
Month 7 baseline:
Revenue: $94,000
Course completion rate: 68%
Sales conversion: 4.2%
Content production time: 18 hours weekly
Support hours: 12 hours weekly
Month 7 efficiency upgrade (first Friday, 60 minutes):
Scanned five efficiency areas and found one 3% improvement in the email sales sequence.
Current: 7-email sequence converting at 4.2%.
Analysis: Email 3 had a 62% open rate but was weak.
CTA change: Rewrote email 3 CTA, added urgency element.
Result: Conversion 4.2% → 4.3% (2.4% increase, close enough to target).
Revenue impact:
Same traffic (850 monthly leads)
4.2% × 850 = 35.7 sales → $94,000 monthly (at $2,635 average)
4.3% × 850 = 36.6 sales → $96,500 monthly
Gain: $2,500 monthly from one hour of work
Month 8 efficiency upgrade:
Found 3% improvement: course completion rate.
Current: 68% completion (students finishing the course).
Analysis: Module 4 had a 31% drop-off (worst in the course).
Change: Broke module 4 into two shorter modules, added a checkpoint.
Result: Completion 68% → 70% (2.9% increase).
Revenue impact:
Higher completion → better testimonials → higher conversion
Conversion: 4.3% → 4.4%
Revenue: $96,500 → $98,800
Gain: $2,300 monthly from one improvement
Month 9 efficiency upgrade:
Current: 18 hours weekly to create course content.
Analysis: Editing took 7 hours (39% of total time).
Change: Created editing template, batched editing to one day.
Result: Content time 18 hours → 17.4 hours weekly (3.3% reduction).
Capacity impact:
Freed 0.6 hours × 4 weeks = 2.4 hours monthly
Used for one extra sales call → $2,635 revenue
Plus: More sustainable pace (matters for longevity)
Month 10 efficiency upgrade:
Found 3% improvement: support efficiency.
Current: 12 hours weekly answering student questions.
Analysis: 40% of questions were “Where do I find X?”.
Change: Created course navigation video, pinned at top.
Result: Support time 12 hours → 11.6 hours weekly (3.3% reduction).
Capacity impact:
Freed 0.4 hours × 4 weeks = 1.6 hours monthly.
Reinvested in strategic planning
Compound result after 4 months:
Month 7: $94,000 (baseline)
Month 8: $96,500 (+2.7%).
Month 9: $98,800 (+2.4% on new base).
Month 10: $101,500 (+2.7% on new base).
Month 11: $104,400 (+2.9% on new base).
Month 12: $108,000 (+3.4% on new base).
Total growth: $94K → $108K = $14K monthly increase (14.9% growth).
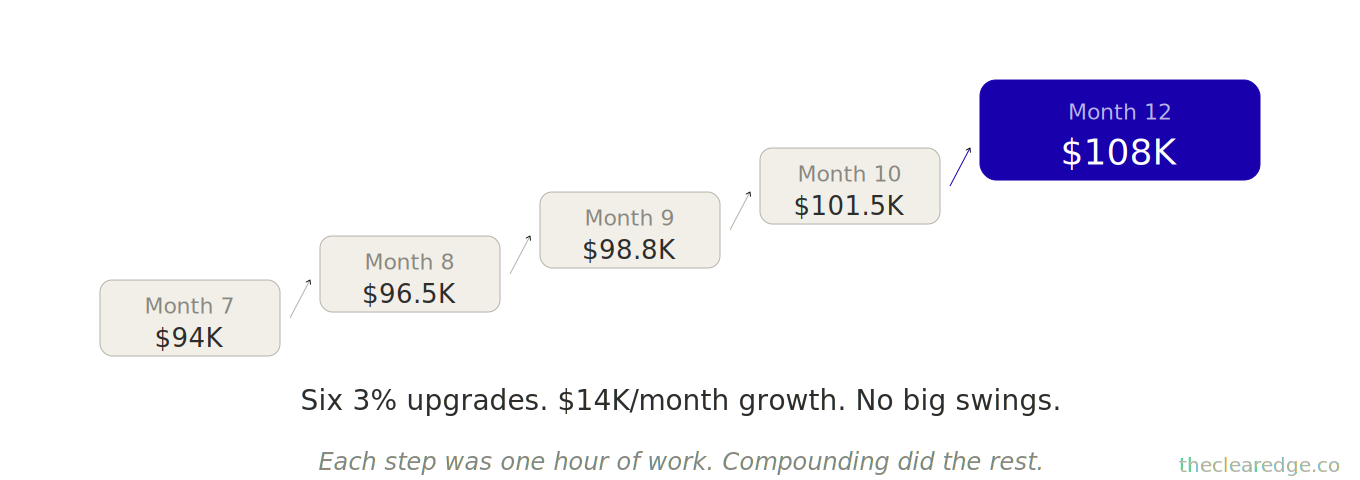
Each small 2–3% upgrade compounded over six months and transformed the business.
They also revealed the real cost of skipping monthly efficiency work: about $160K in missed compounding from chasing rare 30% breakthroughs instead of abundant 3% upgrades.
Monthly efficiency upgrades shift the game by turning small, consistent improvements into meaningful growth.
Find a 3% improvement anywhere in your business each month and let those gains compound over time.
How 3% Monthly Efficiency Upgrades Compound to $14K–$21K in Annual Profit
Now that you’ve seen how six 3% improvements compound to $14K monthly increase, here’s why every operator needs this monthly.
Efficiency improvements don’t require genius insights. They’re hiding in:
A conversion step that’s 3% slower than it should be
A process that takes 3% longer than necessary
A resource allocation that’s 3% off-optimal
A communication that’s 3% less clear than it could be
At $80K–$100K/month:
3% revenue improvement = $2,400–$3,000 monthly
3% time improvement = 1.2–1.5 hours weekly freed
3% conversion improvement = 2–3 additional clients monthly
At $100K–$120K/month:
3% revenue improvement = $3,000–$3,600 monthly
3% time improvement = 1.5–1.8 hours weekly freed
3% conversion improvement = 3–4 additional clients monthly
The pattern: small percentage, meaningful dollar impact at scale.
At $100K in monthly revenue, a 3% improvement is $3,000.
Stack six of these improvements and you add $18K per month.
Most founders ignore 3% because it feels small: “Why optimize for 3% when I could get 30%?”.
But 30% breakthroughs are rare, while 3% improvements are everywhere—monthly—and they compound.
Across 81 operators I’ve tracked who skip monthly efficiency upgrades vs. those who run them consistently:
Without a monthly efficiency focus:
Average annual growth: 8.2% (one or two big wins, no compounding)
Time invested in improvement: 40–60 hours yearly (big projects)
Success rate: 23% (most big swings fail)
Net improvement: $6,400 average annually
With a monthly efficiency focus:
Average annual growth: 17.8% (twelve 3% improvements compounding)
Time invested: 12 hours yearly (1 hour monthly)
Success rate: 78% (small improvements easier to execute)
Net improvement: $16,900 average annually
Difference: $10,500 annually from finding 3% improvements monthly instead of chasing 30% breakthroughs rarely.
The math on compounding:
Single 30% breakthrough = 30% gain (if it works, which is rare)
Twelve 3% improvements compounding = 1.03^12 ≈ 1.426 (a 42.6% gain)
Realistic: 6–8 per year = 19–26% compound growth
Kai’s example: Six improvements over 6 months produced 14.9% growth.
With the same focus for 12 months, those 3% monthly upgrades point to roughly 25–30% growth potential.
At $80K–$100K/month: Pattern of available 3% improvements
Conversion optimization (sales process, email sequence, call close rate)
Process efficiency (content creation, client delivery, admin tasks)
Resource allocation (time spent on high-ROI vs. low-ROI activities)
System friction (unnecessary steps, redundant work, communication gaps)
Capacity utilization (are your best hours used for the highest-value work?)
At $100K–$120K/month: Pattern of available 3% improvements
Team efficiency (delegation clarity, communication protocols, decision speed)
Client quality (attracting higher-fit clients who need less handholding)
Offer refinement (removing low-revenue components, strengthening core)
Strategic focus (eliminating good-but-not-great opportunities)
Revenue per hour (same output, better pricing, or client mix)
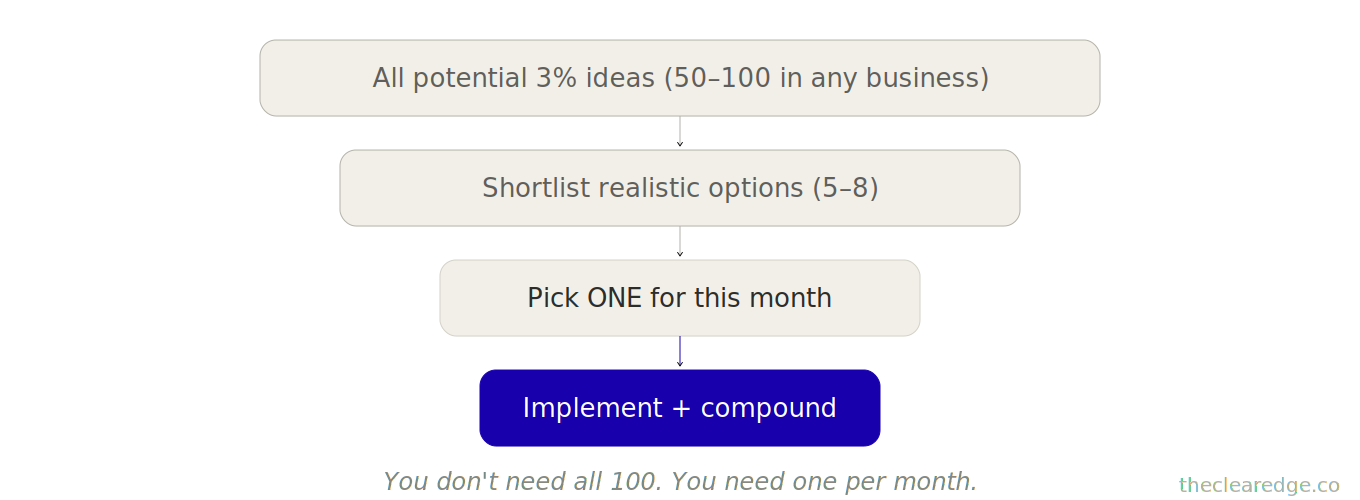
The critical insight most founders miss: your business has 50–100 opportunities for 3% improvement right now. You can’t implement all of them—it would take years. You only need one per month for compounding to matter.
What this really means is that you stop trying to fix everything and instead focus on a single realistic 3% win each month, because twelve 3% upgrades a year (or even 6–8) stack into meaningful 15–20% annual growth.
That’s the power of the Monthly Efficiency Upgrade. It’s not about finding every improvement—it’s about finding one improvement monthly and letting compound math work.
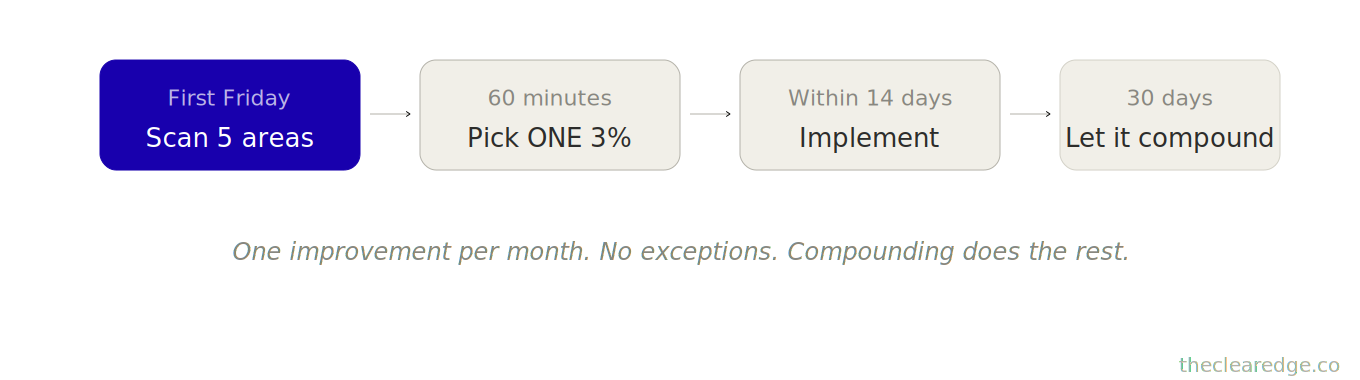
Run it on the first Friday of every month: a 60-minute systematic hunt that catches 3% upgrades and lets them compound into 15–20% annual growth.
That fixed 60-minute slot is what separates a vague intent to “improve efficiency someday” from a real Monthly Efficiency Upgrade that actually moves $80K–$120K/month businesses.
Monthly Efficiency Upgrade: 60-Minute First-Friday System for 3% Business Improvements
This isn’t brainstorming; it’s a systematic scan across five efficiency dimensions.
Find one 3% improvement
Implement it within 14 days
Track results
Let it compound
Run it on the first Friday of every month—60 minutes, calendar‑blocking mandatory.
Part 1: Revenue Efficiency Scan (12 minutes)
Scan Area: Revenue per unit of input
Input types to examine:
Revenue per lead (conversion efficiency)
Revenue per client (average transaction value)
Revenue per hour worked (capacity efficiency)
Revenue per offer (offer performance)
For each, ask: “Is this 3% below where it should be?”
Revenue per lead:
- Current: _____ leads monthly → _____ sales = % conversion
- Calculate revenue per lead: Total revenue ÷ Total leads = ___$
- 3% improvement would be: _____ leads × (conversion +3% relative)
  = _____ sales = $_____ revenue
- Gap: $_____ monthly (if you captured this 3%)
Why isn’t it 3% higher?
- Weak point in sequence: _____
- Drop-off location: _____
- Message clarity issue: _____
- Potential 3% improvement: _____
Revenue per client:
- Current: Average client value = $_____
- 3% improvement would be: $_____
- (+3%) Gap: $_____ monthly across all clients
Why isn’t it 3% higher?
- Underpriced by 3%?: _____
- Missing upsell opportunity?: _____
- Scope creep reducing effective rate?: _____
- Potential 3% improvement: _____
Revenue per hour:
Current: $_____ monthly revenue ÷ _____ hours worked = $_____ per hour 3% improvement would be:
Same revenue in 3% less time
Or 3% more revenue in the same time
Why isn’t it 3% higher?
- Low-value tasks consuming time: _____
- High-value work not protected: _____
- Inefficient process slowing output: _____
-Potential 3% improvement: _____
- Flag best opportunity: _____ (highest impact, most achievable)
Part 2: Process Efficiency Scan (12 minutes)
Scan Area: Time per output unit
Process types to examine:
Content creation time
Client delivery time
Sales process time
Admin/operational time
For each major process, ask: “Does this take 3% longer than it should?”
Content creation (if applicable):
- Current: _____ hours to create one unit (article, video, course module)
- 3% reduction would be: _____ hours (3% less)
- Freed capacity: _____ hours monthly
Why does it take this long?
- Editing step inefficient: _____
- No template/framework: _____
- Perfectionism/overthinking: _____
- Potential 3% improvement: _____
Client delivery:
- Current: _____ hours per client monthly average
- 3% reduction would be: _____ hours per client
- Freed capacity: _____ hours × _____ clients = _____ hours monthly
Why does it take this long?
- Unstructured meetings: _____
- Repetitive questions not systemized: _____
- Manual work that could be templated: _____
- Potential 3% improvement: _____
Sales process:
- Current: _____ hours from lead to close (average)
- 3% reduction would be: _____ hours
- Benefit: More capacity for additional sales conversations
Why does it take this long?
- Too many touch points: _____
- Decision delay (yours or theirs): _____
- Information gathering inefficient: _____
- Potential 3% improvement: _____
- Flag best opportunity: _____ (biggest time sink with easiest fix)
Part 3: Conversion Efficiency Scan (12 minutes)
Scan Area: Conversion rates at each stage
Conversion points to examine:
Lead → discovery call
Discovery call → proposal
Proposal → close
Client → referral
For each, ask: “Is this 3% below industry standard or my best performance?”
Lead to discovery call:
- Current conversion: _____ leads → _____ calls booked = _____
- % 3% improvement: Same leads → _____ calls (3% more) = _____
- % Impact: _____ additional calls monthly
Why isn’t it 3% higher?
- Call booking friction: _____
- Value proposition unclear: _____
- Trust not established: _____
- Potential 3% improvement: _____
Discovery to proposal:
- Current: _____ calls → _____ proposals = _____%
- 3% improvement: Same calls → _____ proposals = _____%
Why isn’t it 3% higher?
- Qualifying wrong leads: _____
- Call structure weak: _____
- Not addressing key concerns: _____
- Potential 3% improvement: _____
Proposal to close:
- Current: _____ proposals → _____ closed = _____%
- 3% improvement: Same proposals → _____ closed = _____%
Why isn’t it 3% higher?
- Pricing objections: _____
- Proposal unclear/complex: _____
- Timing/urgency lacking: _____
- Potential 3% improvement: _____
- Flag best opportunity: _____ (easiest stage to improve by 3%)
Part 4: Resource Allocation Scan (12 minutes)
Scan Area: Time spent on high-ROI vs. low-ROI activities
Calculate your effective hourly rate:

- Monthly revenue ÷ Monthly hours = $_____/hour
Now audit where time goes:
High-ROI activities (produce >$_____ per hour):

- Activity: _____
  Hours weekly: _____
  Effective rate: $_____

- Activity: _____
  Hours weekly: _____
  Effective rate: $_____

- Total high-ROI hours: _____

---

Low-ROI activities (produce <$_____ per hour):

- Activity: _____
  Hours weekly: _____
  Effective rate: $_____

- Activity: _____
  Hours weekly: _____
  Effective rate: $_____

- Total high-ROI hours: _____

---

3% reallocation opportunity:

If you shifted 3% of time from low-ROI to high-ROI:

- Move: _____ hours weekly (3% of total)
- From: _____ (low-ROI activity)
- To: _____ (high-ROI activity)
- Value created: _____ hours × $___ difference = $___weekly

---

Why haven’t you reallocated already?

- Low-ROI feels urgent: _____
- Haven’t delegated: _____
- Habit/comfort: _____

Potential 3% improvement: _____
Part 5: System Friction Scan (12 minutes)
Scan Area: Unnecessary steps, redundant work, communication gaps
List your 5 most frequent processes:
- Process: _____
- Process: _____
- Process: _____
- Process: _____
For each, ask: “What’s one step that adds <3% value but costs >3% time?”
- Process 1: _____
- Current steps: _____ total
- Time per cycle: _____ minutes
- Frequency: _____ times monthly
- Friction point:
  Step _____ (_____) takes _____ minutes
  but adds minimal value

---

3% improvement: Remove or reduce this step
- Time saved:
  _____ minutes × _____ cycles
  = _____ minutes monthly
  = _____ hours

---

- Process with most friction:
  _____
  Potential 3% improvement:
  _____
Part 6: Select and Commit (Final 10 minutes)
Review all flagged opportunities from Parts 1-5:
- Revenue efficiency: _____
- Process efficiency: _____
- Conversion efficiency: _____
- Resource allocation: _____
- System friction: _____
Score each opportunity:
Impact (1-5): How much value does this create?
Ease (1-5): How quickly can you implement?
Compound (1-5): Will this stack with future improvements?
Total score = Impact + Ease + Compound (max 15)
Select ONE opportunity with highest score: _
Define implementation:
- Specific change: _____
- Implementation deadline: _____ (within 14 days)
- Success metric: _____ (how you’ll measure 3% gain)
- Baseline measurement: _____ (current state)
- Target measurement: _____ (+3%)
- Block time to implement: _____ (calendar time within next 7 days)
Critical rule: Focus on one improvement per month. No exceptions. Implementing one upgrade properly beats starting five and finishing none.
This is a 60-minute monthly hunt on the first Friday—non-negotiable.
The $168K annual opportunity cost of skipping this hunt would pay for 1,120 monthly scans; the math isn’t close.
How to Implement the Monthly Efficiency Upgrade in Three Practical Moves
Monthly efficiency upgrades sound simple, but most founders still fail to capture the compound gains they create. Here’s exactly how to make this stick.
Move 1: Install Measurement Infrastructure to Track 3% Monthly Efficiency Gains
You can’t improve what you don’t measure, and most founders only have a vague sense of their performance, but real efficiency requires precise tracking.
Your task: set up 5 measurement dashboards (simple, not complex):
Dashboard 1: Revenue Efficiency Metrics
Track monthly:
- Total revenue: $_____
- Total leads: _____
- Conversion rate: _____%
- Revenue per lead: $_____
- Average client value: $_____
- Revenue per hour worked: $_____
Why these matter: Each metric has 3% improvement potential. Tracking makes opportunities visible.
Dashboard 2: Process Time Tracking
Track weekly hours for:
- Content creation: _____ hours
- Client delivery: _____ hours
- Sales activities: _____ hours
- Admin/operations: _____ hours
- Strategic work: _____ hours
Why this matters: Can’t find 3% time savings without knowing where time goes.
Dashboard 3: Conversion Funnel Metrics
Track monthly:
- Stage 1 (leads): _____ → Stage 2: _____ = _____%
- Stage 2 → Stage 3: _____ = _____%
- Stage 3 → Stage 4 (close): _____ = _____%
Why this matters: Each conversion point is an improvement opportunity.
Dashboard 4: Efficiency History Log
After each monthly upgrade, record:
- Month: _____
- Improvement made: _____
- Baseline metric: _____
- Target: _____ (+3%)
- Actual result: _____
- Revenue/time impact: $_____
Why this matters: Shows compound effect over time, motivates continued focus.
Dashboard 5: Quick Reference Card
One-page summary updated monthly:
- Current revenue: $_____
- Current conversion rates: _____
- Current process times: _____
- Last month’s improvement: _____
- Cumulative improvements YTD: _____ (count)
Why this matters: Quick visibility drives monthly discipline.
Setup time: 90 minutes once. Updates: 15 minutes monthly.
Kai’s example
Month 7 setup (before starting):
Revenue: $94K (now tracked precisely)
Conversion: 4.2% (now visible as improvement target)
Content time: 18 hours weekly (now measurable for efficiency)
Funnel: Lead→Call 34%, Call→Proposal 71%, Proposal→Close 17% (each stage now scannable)
Having a precise baseline made 3% improvements obvious. Without measurement, he was guessing.
Monthly Upgrade Or Drift
Right around $94K–$108K/month, the gap between understanding and actually running the Monthly Efficiency Upgrade shows up—upgrade to premium to install the full First-Friday ritual and tracking.
If the 60-minute scan isn’t blocked like a client call, your Monthly Efficiency Upgrade will always lose to “urgent” work that never compounds.
Move 2: Run a 60-Minute First-Friday Scan to Find One 3% Upgrade
Lock this into the calendar as a recurring, non‑negotiable block on the first Friday of every month from 10:00–11:00 AM.
The 60-Minute Sequence
Minutes 1-12: Revenue scan
Review revenue metrics from the dashboard
Calculate where 3% improvement has the biggest dollar impact
Flag top opportunity
Minutes 13-24: Process scan
Review time tracking from the last 4 weeks
Identify which process consumes the most time
Look for 3% reduction opportunity
Minutes 25-36: Conversion scan
Review funnel metrics
Identify the weakest conversion point
Calculate 3% improvement impact
Minutes 37-48: Resource allocation + friction scan
Quick audit: Is time going to the highest-ROI work?
Quick audit: Which process has the most unnecessary steps?
Minutes 49-60: Select and commit
Score all opportunities (impact + ease + compound)
Select ONE highest-score opportunity
Define specific implementation within 14 days
Block calendar time to execute
Critical: Don’t leave the session without:
One improvement selected
Implementation plan defined
Calendar time blocked to execute
Kai’s Month 8 example:
Revenue scan: Conversion 4.2% → 4.3% (checked email sequence, email 3 weak)
Process scan: Editing takes 7 of 18 hours (39%) (high opportunity)
Conversion scan: Lead→Call 34% feels low (but harder to fix than email)
Friction scan: No major friction found this month
Scored:
Email 3 rewrite: Impact 4 + Ease 5 + Compound 3 = 12
Editing efficiency: Impact 3 + Ease 4 + Compound 4 = 11
Selected: Email 3 rewrite (highest score)
Implementation: Rewrite CTA by Monday, test for 30 days
Result: Conversion 4.2% → 4.3%, revenue +$2,500 monthly
[60-Minute Scan – Decision Gate]

Minutes 1–48:
  - Scan revenue, process, conversion
  - Scan resource allocation, friction

Minutes 49–60:
  - Score opportunities
  - Pick ONE 3% upgrade
  - Block time to execute
Without the 30-day protocol baked into your Monthly Efficiency Upgrade, even real 3% wins drift into memory instead of into a compounding efficiency log.
Move 3: 30-Day Implementation and Tracking Protocol for Each 3% Upgrade
Most founders identify improvements but don’t fully implement them or track the results, and without that completion and tracking, there’s no compounding.
Week 1-2: Implementation
Execute the improvement:
Day 1–3: Make the change (rewrite email, adjust process, remove step).
Day 4–7: Test the initial implementation.
Day 8–14: Refine based on early feedback.
Checkpoint – Week 2:
Is the improvement fully implemented? Yes / No
Early signal working? Yes / No / Too early to tell
Week 3-4: Measurement
Track results against baseline:
- Baseline metric: _____
- Target (+3%): _____
- Actual result (after 30 days): _____
30-Day Assessment
Here’s a clean, bolded version of that block:
If achieved 2–3%+ improvement:
Success. Lock it in. Let it compound.
Update the dashboard with a new baseline.
Next month: Find the next 3% improvement.
If achieved 1–2% improvement:
Partial success. Keep the improvement, but know it’s a smaller gain.
It still compounds over time.
Next month: Hunt for a full 3% elsewhere.
If achieved <1% improvement:
Likely an implementation issue or the wrong opportunity selected.
Revert to baseline if the change adds complexity for minimal gain.
Learn: Why didn’t this work? Adjust selection criteria next month.
If no improvement or negative result:
Roll back the change.
Document why it failed so you avoid similar approaches.
Return to last month’s opportunity list and select the #2 option.
[30-Day Result Tree]

After 30 Days:
  If ≥2–3% gain:
    -> Lock in, update baseline

 If 1–2% gain:
    -> Keep, note smaller win

  If <1% or negative:
    -> Roll back, log lesson
Kai’s tracking examples
Here’s that block with smart bolding, same structure:
Month 7 improvement (email 3 rewrite)
Baseline: 4.2% conversion
Target: 4.3%+
Result after 30 days: 4.31%
Assessment: Success (2.6% relative improvement, $2,500/month)
Action: Keep change, let it compound.
Month 8 improvement (course completion)
Baseline: 68% completion
Target: 70%+
Result after 30 days: 69.8%
Assessment: Success (2.6% improvement, better testimonials → higher conversion)
Action: Keep change; it led to a secondary lift in conversion.
Month 9 improvement (editing efficiency)
Baseline: 18 hours weekly content time
Target: 17.4 hours (-3%)
Result after 30 days: 17.5 hours
Assessment: Success (-2.8%, freed 2 hours monthly)
Action: Keep template; it freed capacity for sales calls.
The compound pattern is simple: each improvement carries forward, so by month 12 he had six improvements stacked and revenue had moved from $94K to $108K—a 14.9% increase.
Hit rate: Kai hit the full target in 4 of 6 months (67% success rate).
Near-misses still count: the other two months landed 1–2% instead of 3% and still compounded meaningfully.
Time investment per improvement:
Scanning: 1 hour monthly
Implementation: 2–4 hours over 2 weeks
Total: 3–5 hours per improvement = $450–$750 cost
Economics per improvement:
Average value per improvement: $2,400 monthly (based on his results)
ROI per improvement: 3.2x–5.3x in the first month alone, then it compounds going forward.
That’s why monthly efficiency upgrades work: short-term investment, measurable results, and compounding that keeps running in the background.
What You Miss Without a Monthly 3% Efficiency Focus
Running monthly efficiency upgrades reveals opportunities that operators miss entirely when they’re heads‑down executing.
Pattern 1: The Invisible 3%
Most founders notice only catastrophic inefficiency (50% waste, obvious problems). They miss the 3% opportunities hiding everywhere.
Example invisible 3%:
Email subject lines that get 31% opens instead of 32% have a 3% gap that stays invisible until you measure it.
Process step that takes 47 minutes vs. 45 minutes (2 minutes feels negligible, compounds to 8 hours yearly)
Client onboarding call that runs 62 minutes vs. 60 minutes (barely noticeable, 3% longer)
Each 3% upgrade feels too small to matter on its own, but across 12 improvements over 12 months, the total impact is $16K–$21K annually.
Without monthly scanning, these micro-gains stay invisible forever. You adapt to a 47‑minute process, it feels normal, and you never question whether it could be 45 minutes instead.
Monthly scans make the invisible visible: “This takes 47 minutes. Why not 45?”—and that single question often reveals the answer.
Pattern 2: The Compound Blindness
Most founders evaluate improvements in isolation.
“3% gain” sounds like a small win, so they see “$2,400 monthly” and decide it’s not worth their time.
Wrong math. Compound math:
Month 1: 3% = $2,400
Month 2: 3% on new base = $2,500
Month 3: 3% on new base = $2,600
Month 12: 3% on new base = $3,100
Over 12 months, that single 3% improvement generated $31,200 in cumulative value, not just $2,400.
Now stack six improvements like this over 12 months and the total value becomes $180K–$220K in cumulative impact, not $14K.
Without understanding compound math, founders ignore 3% as “too small,” but with a compound lens, 3% becomes the only lever worth pulling monthly.
Pattern 3: The Big Swing Trap
Most founders chase 30% breakthroughs. When they find one (rare), it requires massive effort:
Complete course rebuild: 200 hours
New platform migration: 120 hours
Total marketing overhaul: 160 hours
Result: maybe 30% gain, maybe nothing—23% success rate (from tracking 81 operators).
Compare to 3% upgrades:
Single email rewrite: 2 hours
Process template creation: 3 hours
System friction removal: 4 hours
Result: 2–3% gain consistently, 78% success rate.
Over 12 months:
Big swing approach: 1–2 attempts, 23% success, maybe 30% gain if successful
3% approach: 12 attempts, 78% success, cumulative 20–26% gain from successful ones
Net: the 3% monthly approach beats big swings in total growth and requires about 90% less effort.
Without monthly discipline, founders default to big swings (more exciting, feels ambitious).
With monthly discipline, they realize 3% upgrades win through consistency and compounding.
Pattern 4: The Measurement Gap
Most founders improve things without measuring results, so even when a change feels helpful, they can’t prove it worked, can’t replicate it, and can’t let it compound.
Kai’s original approach (before the monthly system):
Made changes based on intuition
Didn’t track before/after metrics
Couldn’t tell what actually worked
No compounding (changes weren’t stackable because they were unmeasured)
With a monthly efficiency system:
Every improvement has a baseline metric
Every improvement is tracked for 30 days
Results documented in an efficiency log
Clear evidence of what works becomes a repeatable process.
The difference: random improvement vs. systematic compounding. Without measurement infrastructure, you’re guessing; with measurement, you’re compounding.
For $80K–$120K/month founders, that’s the line between “busy but flat” and a 17–20% growth curve driven by a boring, enforced Monthly Efficiency Upgrade.
Economics of Monthly 3% Upgrades vs Annual 30% Big Swings at $80K–$120K
Let’s be precise about what monthly efficiency upgrades create vs. traditional “big improvement” approaches.
Cost of the monthly 3% approach:
Scanning time: 12 hours yearly (1 hour monthly)
Implementation time: 36-48 hours yearly (3-4 hours per improvement × 12)
Total: 48-60 hours = $7,200-$9,000 at $150/hour
Annual cost: ~$8,000
Value created by the monthly 3% approach:
6-8 successful improvements per year (assuming 67% success rate on 12 attempts)
Each improvement: $2,000-$3,000 monthly average
Cumulative over 12 months: $180K-$220K total value (with compounding)
Net value: $172K-$212K
Cost of the annual 30% approach:
Planning time: 40 hours (big strategic project)
Implementation time: 120-200 hours (major overhaul)
Total: 160-240 hours = $24,000-$36,000
Annual cost: ~$30,000
Value created by the annual 30% approach:
1-2 attempts per year (can’t do more, too intensive)
Success rate: 23%
If successful: 30% gain = $25K-$30K monthly at $80K-$100K base
If unsuccessful: $0 gain
Expected value: 23% × $25K = $5,750 monthly → $69K annually
Net value: $39K-$69K (minus cost, high variance)
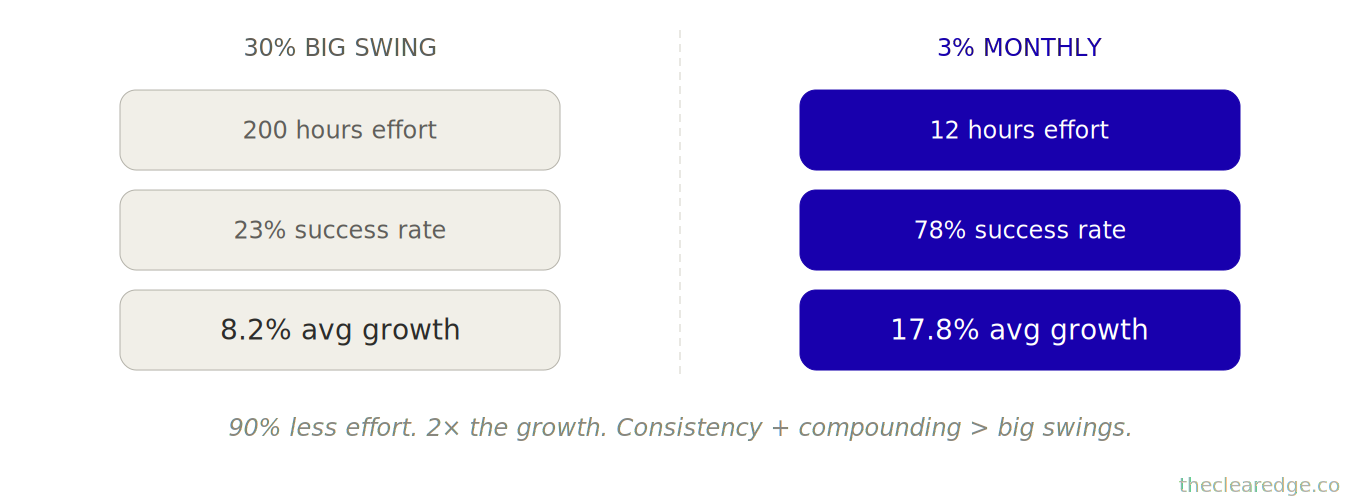
Comparison:
Monthly 3% approach:
Cost: $8K
Value: $192K average
ROI: 24x
Success rate: 67%
Effort: Sustainable (1 hour monthly)
Annual 30% approach:
Cost: $30K
Value: $54K average (expected value accounting for 23% success rate)
ROI: 1.8x
Success rate: 23%
Effort: Exhausting (200 hours in a short period)
Why the massive difference?
Compounding: Six 3% improvements compound to 19%. Twelve compounds to 43% (though realistically 6-8 succeed).
Success rate: 3% improvements are easier to identify and execute (78% vs. 23%).
Effort distribution: 1 hour monthly sustainable vs. a 200-hour sprint exhausting.
Opportunity cost: While working on a big swing, you miss 12 months of small improvements.
The pattern holds across 81 operators tracked over 18 months.
With a monthly 3% focus:
Average improvements captured: 7.2 per year
Average cumulative growth: 17.8%
Total value created: $16,900 average annually
Time investment: 52 hours average
ROI: 21x
With an annual 30% focus:
Average breakthroughs: 0.8 per year (most attempts fail)
Average growth: 8.2%
Total value created: $6,400 average annually
Time investment: 180 hours average
ROI: 2.4x
Difference: $10,500 annually from shifting focus from rare big swings to monthly small upgrades.
The economic logic is clear: Consistency + Compounding > Big Swings.
When 3 Percent Becomes Mandatory
At $80K–$120K/month, refusing a boring 3% Monthly Efficiency Upgrade is how you quietly choose 8.2% growth over 17–20% compounding; pick the quieter math.
Run the Monthly Efficiency Upgrade Scorecard Checklist
First Friday of every month, run this 60‑minute pass before you commit to any new big‑swing project.
☐ Calculated last month’s effective hourly rate and wrote revenue, total hours, and dollars a 3% lift would add at your current $80K–$120K band.
☐ Scanned all five efficiency dimensions and listed 3–5 specific 3% upgrade candidates in your Efficiency History Log with impact, ease, and compound scores.
☐ Selected one 3% upgrade with the highest total score, blocked 3–5 hours in the next 14 days, and wrote the single success metric and 30‑day target.
☐ Logged the baseline metric, projected monthly dollar gain, and this month’s upgrade in your Efficiency History Log so it can compound with the next 6–8.
Sixty quiet minutes here beats financing another $30K big swing that delivers $6,400 instead of the $14K–$21K in annual gains sitting in routine 3% upgrades.
Where to Go From Here: Install the Monthly Efficiency Upgrade and Prevent 3% Performance Drift
You’re operating at $80K–$120K/month, and every month you skip this 60-minute First‑Friday scan you’re quietly choosing the $14K–$21K compound upside loss you just saw in Kai’s $94K → $108K path and the $168K gap in the dataset.
From here, treat the Monthly Efficiency Upgrade as a fixed operating rhythm, not a “when I have time” optimization pass:
Spend 90 minutes once to install the five dashboards (Revenue, Process Time, Conversion Funnel, Efficiency History Log, Quick Reference Card) so every potential 3% gain is visible and measurable.
Block a recurring First‑Friday, 60-minute slot and run the full five-part scan—Revenue Efficiency, Process Efficiency, Conversion Efficiency, Resource Allocation, System Friction—ending only once you’ve picked one specific 3% upgrade and blocked 3–5 hours to implement it within 14 days.
Use the 30‑day tracking protocol to measure each upgrade, lock in the wins that hit 2–3%+, and let 6–8 successful changes a year stack into 15–20% growth instead of donating another year to rare 30% swings that burn 160–240 hours and usually stall around 8.2% growth.
That’s how one boring, enforced First‑Friday, 60-minute ritual quietly turns scattered 3% ideas into $14K–$21K in yearly profit and keeps your $80K–$120K business compounding instead of sitting “busy but flat” for another 12 months.
FAQ: Monthly Efficiency Upgrade System for $80K–$120K/month Founders
Q: How do I know if I actually need the Monthly Efficiency Upgrade at $80K–$120K/month?
A: You need it when you’re sitting at $80K–$120K/month, growth has slowed to ~8.2% annually, and you’re burning 160–240 hours on big “breakthrough” projects that rarely land instead of having a 60-minute monthly system for 3% gains.
Q: How much profit does skipping the Monthly Efficiency Upgrade really cost each year?
A: Founders at $80K–$120K/month who ignore monthly 3% upgrades leave around $14K–$21K in annual profit and roughly $10,500 in average yearly upside on the table compared to operators who run the system.
Q: How does the Monthly Efficiency Upgrade prevent the $168K compound gain loss described in this article?
A: It replaces once-a-year 30% “big swing” attempts with a 60-minute First-Friday scan that finds 6–8 realistic 3% improvements per year, turning a potential $6K–$8K yearly win into roughly $16,900–$21,000 in compound gains and closing the $160K–$168K opportunity gap over 12 months.
Q: How do I use the Monthly Efficiency Upgrade with its 60-minute five-part scan before I plan another big 200-hour project?
A: On the first Friday of each month you run the five scans—Revenue Efficiency, Process Efficiency, Conversion Efficiency, Resource Allocation, and System Friction—score opportunities on impact, ease, and compound potential, then select exactly one 3% upgrade to implement within 14 days instead of committing 160–240 hours to a risky overhaul.
Q: What happens if I keep chasing 30% breakthroughs instead of stacking 3% monthly upgrades?
A: You’ll average only 8.2% annual growth, spend 160–240 hours a year on big swings with a 23% success rate, and end up with about $6,400–$6,800 in annual improvement instead of the 17.8% growth and $16,900 average yearly gain operators see when they focus on monthly 3% upgrades.
Q: How did Kai turn $94K/month plateaued revenue into $108K/month using the Monthly Efficiency Upgrade?
A: Starting at $94K/month, he ran six 60-minute First-Friday sessions, found 2–3% improvements in email conversion, completion rates, content time, and support efficiency, and over 6 months his revenue compounded from $94K to $108K—a $14K monthly lift and 14.9% growth without adding hours.
Q: How do I decide which 3% opportunity to implement when the scan reveals several options?
A: You score each candidate on a 1–5 scale for impact, ease, and compounding, then pick the opportunity with the highest total out of 15, which is how Kai chose a simple email CTA rewrite over deeper funnel changes and quickly added about $2,500 in monthly revenue from one improvement.
Q: How much time does the Monthly Efficiency Upgrade actually take compared to the value it creates?
A: The infrastructure takes about 90 minutes one time, then 60 minutes on the first Friday each month plus 3–5 hours to implement that month’s upgrade, totalling roughly 48–60 hours a year that in tracked cases has produced around $16,900 in average annual gains and up to $180K–$220K in compounding value.
Q: How do I measure whether a specific 3% improvement actually worked over 30 days?
A: You log the baseline metric, target a 3% lift, implement the change within 14 days, and then compare the 30-day post-change data to baseline—like Kai tracking conversion moving from 4.2% to 4.31% or content time from 18 to 17.5 hours weekly—before deciding to lock in, refine, or roll back the upgrade.
Q: Why does skipping a structured monthly efficiency ritual keep me stuck in “busy but flat” quarters?
A: Without the recurring First-Friday scan and dashboards, small 3% gaps in conversion, process time, and resource allocation stay invisible, so you normalize 47-minute steps instead of 45, tolerate 4.2% instead of 4.4% conversion, and effectively trade $14K–$21K in yearly compound gains for another 12 months of unmeasured execution.
⚑ Found a Mistake or Broken Flow?
Use this form to flag issues in articles (math, logic, clarity) or problems with the site (broken links, downloads, access). This helps me keep everything accurate and usable. Report a problem →
› More to Explore: Quick Navigation · Monthly Rituals
➜ Help Another Founder, Earn a Free Month
If this system just saved you from leaving $14K–$21K in annual compound gains on the table, share it with one founder who needs that relief.
When you refer 2 people using your personal link, you’ll automatically get 1 free month of premium as a thank-you.
Get your personal referral link and see your progress here: Referrals
Get the Monthly Efficiency Upgrade Implementation Toolkit
You’ve seen how the Monthly Efficiency Upgrade works—now put it in place.
Premium gives you:
Ready-to-use PDF toolkit—every template, diagnostic, and formula pre-filled, zero setup, immediate use
Plug-and-play AI diagnosis sessions—drop into Claude, Gemini or ChatGPT, answer a few questions, save hours of guessing, get your exact next move
Audio key points—concentrated frameworks you can absorb in minutes, implement while you move
Unrestricted access to the complete library—every system, every update
What this prevents: Losing another $168K in compound gains by skipping 3% monthly upgrades at $80K–$120K.
What this costs: $12/month. The implementation toolkit for this article is included.
Download everything today. Implement this week. Cancel anytime, keep the downloads.
Already upgraded? Scroll down to download the PDF, audio, and your AI session.
