
The Monthly Drift Audit: The 45-Minute Ritual That Closes the $8K–$14K Monthly Gap Between Strategy and Reality
The Monthly Drift Audit is a 45-minute last-Friday diagnostic that scores six types of strategy drift and triggers the exact 4–16 hour correction your model needs.


The Executive Summary
Founders at $60K–$90K lose $8K–$14K every month to strategy drift—the hidden gap between their plan and execution; a 45-minute Monthly Drift Audit catches it before it snowballs into a forced five-figure reset.
Who this is for: Solo consultants and lean founders at $60K–$90K/month running near 120+ hours of capacity with “stable” revenue but a client mix, pricing, and offers that no longer match the strategy they wrote.
The drift problem: Unmeasured drift quietly turns a planned $82K model into a stuck $68K reality, burns 6 extra hours weekly, and creates $8K–$14K in monthly opportunity cost that can snowball to $89K–$98K over 7–8 months.
What you’ll learn: How to run the Monthly Drift Audit (45-Minute Diagnostic), calculate a six-dimension Drift Score, audit client mix, time allocation, revenue mix, pricing, offer complexity, and system compliance, then trigger a tiered course correction protocol tied to drift severity.
What changes if you apply it: Instead of discovering a 32% off-strategy model after 7.3 months and needing a 3.8-month overhaul, you catch 3–8% drift within 1.4 months, course-correct in 18 days, and turn Alicia-style gaps—$14K/month and $98K over 7 months—into aligned execution around the $82K strategic model.
Time to implement: Build the baseline strategy once in 2 hours, then spend 45 minutes on the last Friday of each month plus targeted 4–16 hour course corrections based on drift score, trading about 9 hours of audits a year for preventing roughly $89K–$110K in opportunity cost from untracked drift.
Written by Nour Boustani for $60K–$90K/month founders who want to close the $8K–$14K monthly gap between strategy and reality without waiting for a $98K drift bill to force a reset.
If strategy drift keeps turning planned $82K models into stuck realities, upgrade to premium and install the Monthly Drift Audit system before the next $89K drift bill lands.
› Library Navigation: Quick Navigation · Monthly Rituals
The $14K Monthly Drift Cost When You Skip This Audit
Strategy drift looks like this:
You write a clear plan—focus on high-ticket clients, cut low-ROI work, protect capacity.
Over the next five months, drift compounds:
First three months: mid-market clients slip back in because they’re “easy yeses.”
Next two months: the low-ROI tasks you cut return as “small exceptions.”
By month six, your calendar is executing a different business than the one you planned.
What felt like harmless one-off decisions has turned into $48K–$84K in misallocated capacity.
Here’s what that looks like in real numbers.
Alicia, solo consultant, running at $68K/month.
No monthly drift audit. Just executing. Revenue looked stable.
But month-over-month:
Strategy said: Focus on 6-8 high-ticket clients ($3,500+ monthly each)
Reality was: Serving 14 clients (8 high-ticket at $3,800 average, 6 mid-market at $1,200 average)
Result: 40% of capacity going to clients generating 21% of revenue
The cost:
8 high-ticket clients × $3,800 = $30,400
6 mid-market clients × $1,200 = $7,200
Total: $37,600 monthly
But capacity analysis showed:
High-ticket clients: 12 hours weekly × 8 = 96 hours weekly
Mid-market clients: 8 hours weekly × 6 = 48 hours weekly
Total: 144 hours weekly (impossible—she only had 120 sustainable hours)
Reality check: She was actually working 126 hours weekly (6 hours over the sustainable limit), and quality was slipping.
Strategic plan from 8 months prior:
“Replace mid‑market with high‑ticket. Target 10 high‑ticket clients at $4,000 each for $40K monthly at 120 hours weekly.”
Actual execution:
What happened: Drifted back to mixed model.
Why: Added mid-market because they were “easy yeses.” Never said no.
Result: Revenue stuck at $68K for 7 months.
The gap:
$82K strategic target − $68K actual = $14K monthly opportunity cost.
$14K × 7 months = $98K lost to drift.
Month 8: Started monthly drift audit. First audit (45 minutes) caught:
Client mix: 43% off-strategy (should be 100% high-ticket)
Time allocation: 38% going to non-strategic work
Pricing: Unchanged from 9 months ago (strategy said to raise every 6 months)
Capacity: 6 hours over sustainable (burnout building)
Total drift score: 7.2 out of 10 (severe drift).
She course-corrected immediately:
Month 8-9: Transitioned out 4 mid-market clients (gave 60-day notice)
Month 9: Raised prices on the remaining 2 mid-market to $2,400 (half converted, half left—acceptable)
Month 10: Added 2 new high-ticket clients to replace capacity
Month 11: $68K → $76K (drift closing)
Month 13: $82K (on-strategy, sustainable capacity)
Cost of not auditing monthly:
Seven months of drift created $98K in opportunity cost before anyone caught it.
Monthly audits would’ve caught it in month 2.
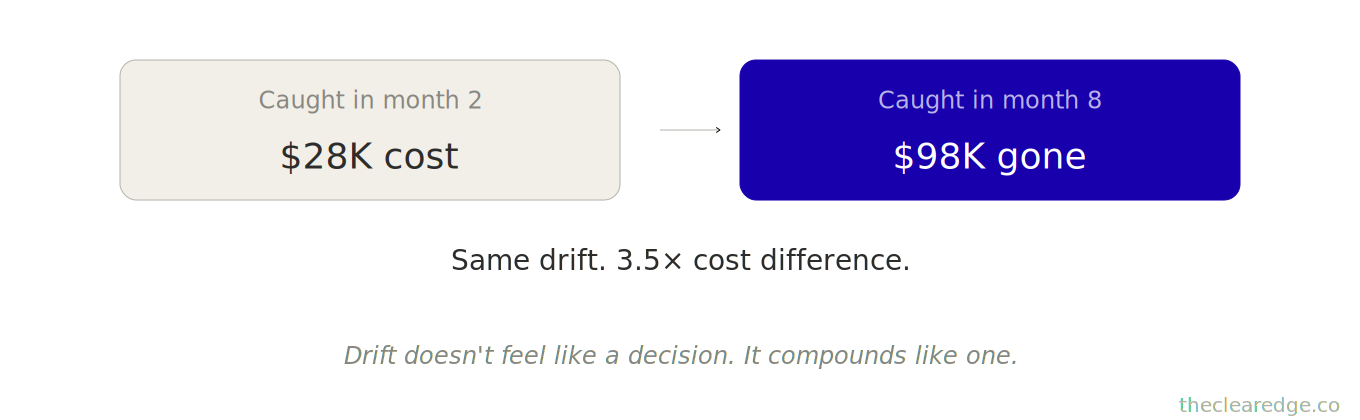
With monthly audits:
Cost: $28K instead of $98K.
The issue isn’t that drift happens. It’s that drift accumulates invisibly—1–2% monthly deviation compounds to a 20–40% gap over 6–12 months.
Monthly drift audits shift economics:
Catch 5% drift in month 1 → two-week course correction.
Catch 35% drift in month 8 → three-month overhaul + $98K opportunity cost.
How Strategy Drift Creates an $8K–$14K Monthly Execution Gap
Now that you’ve seen how one undetected drift costs $98K over 7 months, here’s why every operator needs this monthly.
Strategic drift doesn’t happen overnight. It compounds gradually.
At $50K-$70K/month:
Client mix drifts (strategy says premium, reality serves mid-market)
Time allocation shifts (strategic work gets crowded out by urgent tasks)
Pricing stagnates (planned increases never happen)
At $70K-$90K/month:
Capacity creeps up (sustainable 40 hours becomes unsustainable 50 hours)
Offer complexity increases (started with 1 offer, now juggling 4)
Team coordination overhead grows (delegation drifts back to doing)
At $90K-$110K/month:
Strategic focus fragments (too many initiatives, none fully executed)
Quality standards erode (speed prioritized over excellence)
System compliance drops (built SOPs, stopped following them)
The pattern: execution drifts from strategy slowly—2–3% monthly deviation, invisible week-to-week, obvious only after 6+ months of compound drift.
Why quarterly is too late:
Most founders review strategy quarterly. By then, you’ve drifted 15–25% off course.
Course correction takes months and costs tens of thousands.
Why monthly audits win:
Monthly audits catch drift at 3–5%.
Course correction takes days and costs minimal capacity.
Common drift patterns
Client mix: serving the wrong segments
Time allocation: strategic work gets crowded out
Pricing stagnation: planned increases never happen
Capacity creep: 40 sustainable hours become 50 unsustainable
Offer complexity: started with one offer, now juggling four
System compliance drops: SOPs were built, then ignored
Across 73 operators I’ve tracked who skip monthly drift audits vs. those who run them consistently:
Without a monthly drift audit:
Average time to detect significant drift: 7.3 months
Average drift severity at detection: 32% off-strategy
Average course correction time: 3.8 months
Total opportunity cost: $89,000 average (missed revenue during drift period)
With a monthly drift audit:
Average time to detect drift: 1.4 months
Average drift severity at detection: 8% off-strategy
Average course correction time: 0.6 months (18 days)
Total opportunity cost: $11,000 average
The difference that matters:
It’s not whether drift happens (it always does).
It’s whether you catch it at 8% with the 18-day fix, or at 32% with the 4-month overhaul and $89K opportunity cost.
Here’s the critical insight most founders miss: you’re always drifting.
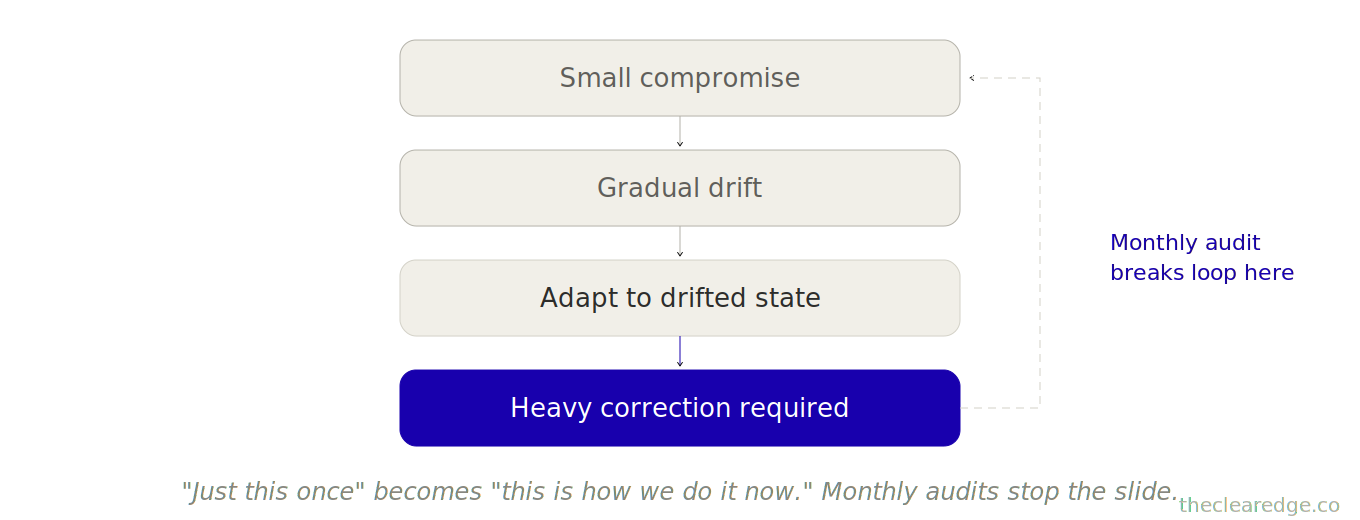
Small decisions compound.
“Just this once” becomes “this is how we do it now.”
One wrong-fit client becomes four.
One missed strategic session becomes three months without strategy time.
Without monthly measurement, drift feels normal.
You adapt to the deviated state.
You forget what you planned.
Three months later, strategy and execution have no relationship.
Monthly audits create accountability for your own strategy—they force the question: “Am I doing what I said I’d do?”, not what feels urgent, but what you decided matters most.
Run the audit the last Friday of every month, 45 minutes, and catch drift before it reaches the $8K–$14K monthly cost threshold.
From here, the work shifts from understanding the drift tax to actually running the 45-minute sequence that keeps your $60K–$90K model inside its intended lane
How to Run the Monthly Drift Audit (45-Minute Strategy Drift Diagnostic)
This isn’t a strategy session—this is a measurement audit.
What you do:
Compare your strategic plan against your actual execution across 6 dimensions.
Flag any drift above 10%.
Course-correct within 14 days.
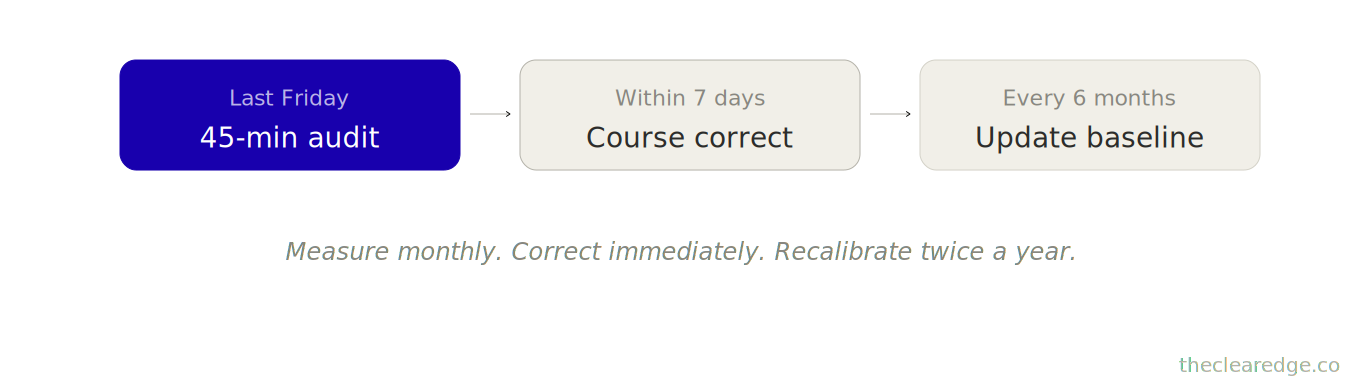
Run this on the last Friday of every month for 45 minutes—calendar-blocking mandatory.
Part 1: Client Mix Drift (8 minutes)
Strategic Plan (from your last strategic planning session):
- Target client profile: _____
- Revenue range: $_____ to $_____
- Ideal client count: _____
- Segments to avoid: _____
Current Reality (this month):
- Total clients: _____
- On-strategy clients: _____ (fit target profile exactly)
- Close-enough clients: _____ (mostly fit, minor drift)
- Off-strategy clients: _____ (shouldn’t have taken them)
Drift Calculation:
On-strategy percentage: (On-strategy clients ÷ Total clients) × 100 = _____%Drift Assessment:
90–100% on-strategy: No drift (green)
70–89% on-strategy: Minor drift (yellow, watch closely)
50–69% on-strategy: Moderate drift (orange, course-correct now)
<50% on-strategy: Severe drift (red, major course correction needed)
Your Status: _
If Yellow/Orange/Red:
- Which clients are off-strategy: _____
- Why did you take them: _____
- Transition plan: _____
- Deadline to execute: _____
Part 2: Time Allocation Drift (8 minutes)
Strategic Plan:
- Strategic work hours weekly:
  _____ hours
  (high-value, moves business forward)

- Operational work hours weekly:
  _____ hours
  (necessary but doesn’t create leverage)

- Maximum sustainable total:
  _____ hours weekly
Current Reality (average last 30 days):
- Actual strategic hours weekly: _____
- Actual operational hours weekly: _____
- Actual total hours weekly: _____
Drift Calculation:
- Strategic time percentage:
  (Actual strategic ÷ Planned strategic) × 100 = _____%

- Total capacity drift: Actual total - Planned total  = _____ hours weekly
Drift Assessment:
Strategic time 90–100% of plan: No drift (green)
Strategic time 70–89% of plan: Minor drift (yellow)
Strategic time 50–69% of plan: Moderate drift (orange)
Strategic time <50% of plan: Severe drift (red)
Capacity Assessment:
Total hours within +5 of plan: Sustainable (green)
Total hours +6 to +15 of plan: Unsustainable (yellow)
Total hours +16+ of plan: Burnout territory (red)
Your Status (Strategic): _
Your Status (Capacity): _
If Yellow/Orange/Red:
- What’s crowding out strategic time: _____
- What can be delegated/eliminated: _____
- How to protect strategic hours: _____
Part 3: Revenue Mix Drift (7 minutes)
Strategic Plan
Current Reality:
- Source 1: _____ = $_____ (_____% of total)
- Source 2: _____ = $_____ (_____% of total)
- Source 3: _____ = $_____ (_____% of total)
- Unplanned sources: _____ = $_____ (_____% of total)
Drift Calculation:
Unplanned revenue percentage: (Unplanned revenue ÷ Total revenue) × 100 = _____%Drift Assessment:
0-10% unplanned revenue: Acceptable drift (green)
11-20% unplanned revenue: Minor drift (yellow)
21-35% unplanned revenue: Moderate drift (orange)
36%+ unplanned revenue: Severe drift (red)
Your Status: _
If Yellow/Orange/Red:
- Why is unplanned revenue happening: _____
- Is it good drift (better opportunity) or bad drift (distraction): _____
- Adjust strategy or course-correct: _____
Part 4: Pricing Drift (7 minutes)
Strategic Plan:
- Target pricing: $_____
- Last increase date: _____
- Next planned increase: _____
- Price review frequency: Every _____ months
Current Reality:
- Current pricing: $_____
- Last actual increase: _____ (date)
- Months since last increase: _____
- Months overdue for review: _____
Drift Calculation:
- Pricing drift: (Current pricing ÷ Target pricing) × 100 = _____%
- Schedule drift: Months overdue for review = _____ months
Drift Assessment:
Pricing at 95–100% of target, on schedule: No drift (green)
Pricing at 90–94% of target, or 1–3 months overdue: Minor drift (yellow)
Pricing at 80–89% of target, or 4–6 months overdue: Moderate drift (orange)
Pricing at <80% of target, or 7+ months overdue: Severe drift (red)
Your Status: _
If Yellow/Orange/Red:
- Why hasn’t pricing increased: _____
- What’s the fear/resistance: _____
- Plan for next increase: _____
- Date committed: _____
Part 5: Offer Complexity Drift (7 minutes)
Strategic Plan:
- Number of core offers: _____
- Offer names: _____
- Offers to sunset: _____
- Maximum manageable offers: _____
Current Reality:
- Active offers: _____ (count all variations you’re selling)
- List all offers: _____
- Unplanned offers added: _____
- Planned offers not built: _____
Drift Calculation:
Complexity drift: Actual offers - Planned offers = _____
(if positive, you’ve added complexity)
Drift Assessment:
Actual = Planned: No drift (green)
Actual = Planned +1: Minor drift (yellow)
Actual = Planned +2–3: Moderate drift (orange)
Actual = Planned +4+: Severe drift (red)
Your Status: _
If Yellow/Orange/Red:
- Why did you add unplanned offers: _____
- Which offers generate <10% revenue: _____
- Sunset plan: _____
Part 6: System Compliance Drift (8 minutes)
Strategic Plan:
Systems built: List _ (SOPs, frameworks, processes you created)
Expected compliance: 90%+ (you follow your own systems 9/10 times)
Current Reality:
For each system, rate compliance:
- System 1: __ | Compliance: __ % (estimate how often you actually follow it)
- System 2: _____ | Compliance: _____ %
(Add more systems as needed)
- Average Compliance: _____ %
Drift Assessment:
85–100% average compliance: No drift (green)
70–84% average compliance: Minor drift (yellow)
50–69% average compliance: Moderate drift (orange)
<50% average compliance: Severe drift (red, systems exist but are ignored)
Your Status: _
If Yellow/Orange/Red:
- Which systems have degraded most: _____
- Why aren’t you following them: _____
- Fix systems or fix compliance: _____
Part 7: Drift Score Calculation (5 minutes)
Total Drift Score:
Count your statuses across all 6 dimensions:
- Green scores: _____ × 0 points = _____
- Yellow scores: _____ × 1 point = _____
- Orange scores: _____ × 2 points = _____
- Red scores: _____ × 3 points = _____
- Total Drift Points: _____ (0-18 possible)
Overall Drift Assessment:
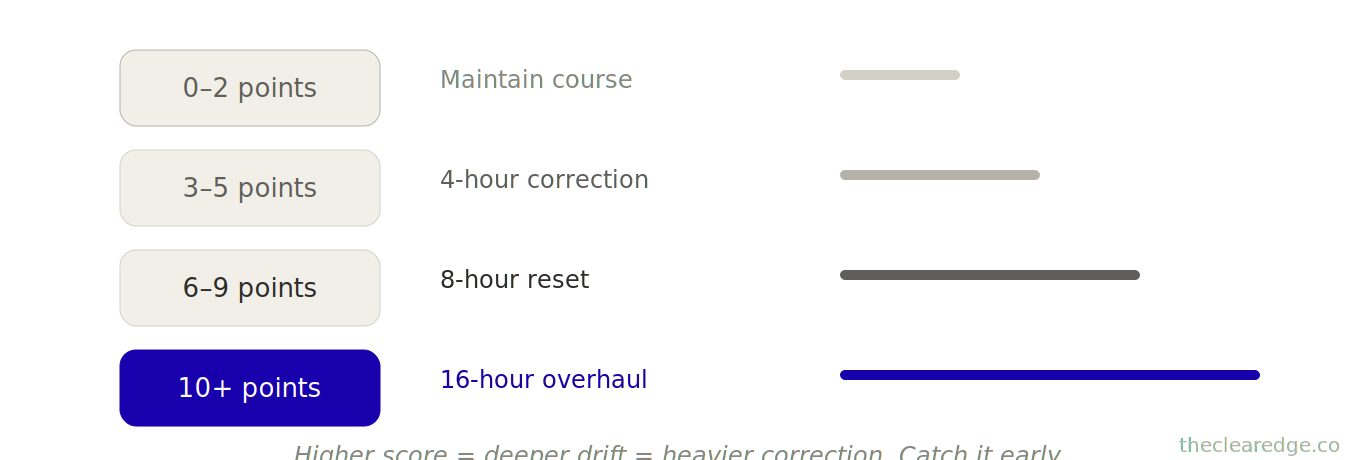
0–2 points: Excellent alignment (minimal drift, maintain current course)
3–5 points: Minor drift detected (course-correct within 14 days)
6–9 points: Moderate drift (course-correct immediately, review strategy)
10+ points: Severe drift (strategy–execution disconnect, major realignment needed)
Your Overall Status: _
If 3+ points: Proceed immediately to the course correction protocol below.
This is a 45-minute monthly audit. Last Friday. Non-negotiable.
Economics:
The $89K average opportunity cost of not auditing monthly buys 593 monthly audits.
The math isn’t close.
Quarterly reviews won’t catch the $8K–$14K monthly drift tax early enough; upgrade to premium to install the Monthly Drift Audit and its 4–16 hour correction protocol.
Install The Monthly Drift Audit
If drift keeps pushing you toward the $89K average opportunity cost, upgrade to premium and install the Monthly Drift Audit as a standing last-Friday, 45-minute ritual.
Three Moves to Implement the Monthly Drift Audit in Your Business
Monthly drift audits sound simple, but most founders still skip them or run them without following through.
Here’s exactly how to make this stick.
Move 1: Establish a Six-Dimension Strategic Baseline in 2 Hours
Document your strategy across six dimensions:
Client mix:
Target profile
Ideal count
Revenue per client
Segments to avoid
Time allocation:
Total sustainable hours
Strategic vs. operational split
Buffer time
Revenue mix:
Primary/secondary sources
Target percentages
Pricing:
Current
Target
Increase schedule
Offers:
Core offers
Maximum complexity
Planned phase-outs
Systems:
Built SOPs
Expected compliance level
Make it specific and measurable.
“Serve great clients” is immeasurable.
“Serve 8 tech consulting clients, $3,500+ monthly each” is measurable.
Create note: “Strategic Baseline - [Date]” with all answers.
This is your measurement standard for all future drift audits.
Update every 6 months as the strategy evolves.
Move 2: Set Up a Last-Friday Monthly Drift Audit Ritual (45 Minutes)
Lock this into your calendar on the last Friday of every month from 3:00–3:45 PM as a recurring, non‑negotiable appointment.
The 45-Minute Sequence
Minutes 1–8: Client Mix Audit
Open client list, categorize: on-strategy / close / off-strategy
Calculate on-strategy percentage
Flag if <90%
If flagged: identify which clients to transition out
Minutes 9–16: Time Allocation Audit
Review the calendar for the last 4 weeks
Calculate average weekly hours (strategic vs. operational)
Calculate total capacity used
Flag if strategic <90% of plan or total >+5 hours sustainable
If flagged: identify what’s crowding out strategic time
Minutes 17–23: Revenue Mix Audit
Pull revenue by source (last 30 days)
Calculate the percentage from each source
Calculate unplanned revenue percentage
Flag if unplanned >10%
If flagged: assess if good drift or bad drift
Minutes 24–30: Pricing Audit
Check current pricing vs. target
Check months since last increase
Flag if pricing <95% target or overdue for review
If flagged: set date for next increase
Minutes 31–37: Offer Complexity Audit
List all active offers
Compare to the strategic plan
Count additions (complexity drift)
Flag if the actual ≠ planned
If flagged: identify offers to sunset
Minutes 38–44: System Compliance Audit
Rate compliance for each system (estimate %)
Calculate average compliance
Flag if average <85%
If flagged: identify why compliance degraded
Minute 45: Calculate Total Drift Score
Count greens, yellows, oranges, reds
Multiply by point values
Total points = drift severity
If 3+ points: schedule course correction session within 7 days
Critical: don’t just audit—act.
The audit includes a mandatory action threshold:
3+ points = course correction within 7 days
Not “maybe” or “when convenient,” but an actual session scheduled.
Alicia’s Month 9 audit (first Friday after detecting drift):
8 minutes: Client Mix Audit
8 high-ticket (on-strategy), 6 mid-market (off-strategy)
57% on-strategy (orange)
Flagged
8 minutes: Time Allocation Audit
Strategic: 8 hours actual vs. 12 planned (67%, orange)
Total: 126 hours vs. 40 planned (red)
Flagged twice
7 minutes: Revenue Mix Audit
Consulting: 100% (on-strategy, green)
Not flagged
7 minutes: Pricing Audit
$3,800 average vs. $4,000 target (95%, green)
Last increase: 3 months ago (on schedule, green)
Not flagged
7 minutes: Offer Complexity Audit
1 core offer as planned (green)
Not flagged
8 minutes: System Compliance Audit
Average: 72% (yellow)
Flagged
Total drift score:
2 greens × 0 = 0
2 yellows × 1 = 2
2 oranges × 2 = 4
1 red × 3 = 3
Total: 9 points (moderate drift)
Result & economics of Alicia’s audit:
Action: Scheduled course correction session for the following Tuesday.
Cost of 45 minutes monthly: 9 hours yearly, worth $1,350 at $150/hour.
Value created: $78K average opportunity cost prevented (catching drift at month 2 vs. month 8).
ROI: 58x. That’s why you do this.
[Course Correction Ladder]

Minor Drift  -> Half-Day Session
Moderate     -> Full Day
Severe       -> Two-Day Overhaul
Then         -> 60-day monitoring
Move 3: Use the Drift Score to Match Course Correction to Severity
Most founders either ignore drift completely or panic and overhaul everything; both are wrong. Instead, match your course correction to the actual severity of the drift.
0–2 Points (Excellent alignment): no correction needed.
Action: document what’s working, maintain current approach
Celebration: most months should be green, acknowledge this
3–5 Points (Minor drift): course-correct within 14 days.
Intervention: half-day strategy session (4 hours)
Focus: address flagged items, adjust execution
Goal: return to 0–2 points next month
6–9 Points (Moderate drift): course-correct within 7 days.
Intervention: full-day strategy reset (8 hours)
Focus: realign major systems, may need to say no to current commitments
Goal: create a 30-day action plan, execute immediately
10+ Points (Severe drift): course-correct within 48 hours.
Intervention: two-day strategic overhaul (16 hours)
Focus: complete strategy–execution realignment
Goal: may need to restructure business model, transition major clients
Follow-up: weekly monitoring for 60 days
3-5 Point Course Correction (Half-Day Session):
Hour 1: Identify Root Causes
For each flagged item, ask: “Why did this drift happen?”
Common causes: said yes when should’ve said no, urgent crowded out strategic, avoided difficult decision
Document root causes: _
Hour 2: Design Corrections
For each flagged item, create a specific action:
Client mix off? List clients to transition out, set a deadline
Time allocation off? Block strategic hours, identify what to delegate
System compliance off? Simplify systems or recommit to following them
Hour 3: Execute High-Priority Actions
Take immediate action on the quickest fixes
Send transition emails, block calendar time, and make pricing decisions
Don’t wait—do it during the session
Hour 4: Prevention System
What will prevent this drift from recurring?
Install checks: weekly review, accountability partner, automated alerts
Document prevention plan: _
Alicia’s course correction (Month 9, Tuesday after audit)
Hour 1: Root causes identified
Client mix drift: said yes to mid-market because feared saying no, wanted quick revenue
Time drift: no calendar protection for strategic time, clients booking freely
Capacity drift: didn’t track hours, slowly added more without realizing
System drift: onboarding SOP too complex, stopped following it
Hour 2: Corrections designed
Client mix: transition 4 mid-market clients over 60 days (2 in month 10, 2 in month 11)
Time: Block Tuesday 9 AM–12 PM and Thursday 9 AM–12 PM to create 6 sacred strategic hours each week.
Capacity: install weekly hour tracking, hard cap at 42 hours
System: simplify onboarding SOP from 12 steps to 6 steps
Hour 3: Immediate execution
Drafted transition email template for mid-market clients
Sent first 2 transition emails (60-day notice)
Blocked strategic time on calendar for next 12 weeks (recurring)
Set up an hour tracking spreadsheet
Hour 4: Prevention installed
Weekly Sunday review: check if strategic hours were protected
Accountability: business coach checks strategic time usage monthly
Decision filter: “Does this align with high-ticket-only strategy?” before saying yes
Month 10 result: drift score dropped from 9 to 4 points
Month 11 result: drift score dropped to 2 points
Month 13 result: 0 points (excellent alignment), revenue $68K → $82K
6-9 Point Course Correction (Full-Day Session):
Hour 1: Identify Root Causes
For each flagged item, ask: “Why did this drift happen?”
Common causes: said yes when should’ve said no, urgent crowded out strategic, avoided difficult decision
Document root causes: _
Hour 2: Design Corrections
For each flagged item, create a specific action:
Client mix off?
List clients to transition out
Set a deadline
Time allocation off?
Block strategic hours
Identify what to delegate
System compliance off?
Simplify systems or recommit to following them
Hour 3: Execute High-Priority Actions
Take immediate action on the quickest fixes
Send transition emails, block calendar time, and make pricing decisions
Don’t wait—do it during the session
Hour 4: Prevention System
What will prevent this drift from recurring?
Install checks: weekly review, accountability partner, automated alerts
Document prevention plan: _
Once you see how quickly small compromises compound into $14K/month gaps, the Monthly Drift Audit stops being “nice to have” and becomes basic infrastructure
What You Miss When You Skip Monthly Strategy Drift Audits
Hour 1: Identify Root Causes
For each flagged item, ask: “Why did this drift happen?”
Common causes: said yes when should’ve said no, urgent crowded out strategic, avoided difficult decision
Document root causes: _
Hour 2: Design Corrections
For each flagged item, create a specific action:
Client mix off?
List clients to transition out
Set a deadline
Time allocation off?
Block strategic hours
Identify what to delegate
System compliance off?
Simplify systems or recommit to following them
Hour 3: Execute High-Priority Actions
Take immediate action on the quickest fixes
Send transition emails, block calendar time, and make pricing decisions
Don’t wait—do it during the session
Hour 4: Prevention System
What will prevent this drift from recurring?
Install checks: weekly review, accountability partner, automated alerts
Document prevention plan: _
Pattern 4: The Revenue Trap
What goes wrong:
Revenue growth can mask strategic drift.
“Revenue is up, so everything must be fine.” Wrong.
Strategy vs. execution:
Strategy: “High-ticket only, $4,000 clients.”
Execution drift: 6 high-ticket ($24K) + 8 mid-market ($9.6K) → $33.6K monthly.
Revenue looks great ($33.6K up from $24K).
Why this is a trap:
Problem: capacity is maxed, can’t scale higher without burning out—stuck.
Strategic path: 8 high-ticket ($32K) at sustainable capacity, with room to add 2 more, creating a $40K ceiling.
Drift path: $33.6K at unsustainable capacity, with no room to scale, leaving you trapped at a lower ceiling.
Revenue growth masked the strategic error; without monthly audits comparing revenue source and capacity, founders miss this trap.
Alicia’s version of the trap:
Revenue at $68K looked stable.
Monthly audit showed she was working 126 hours weekly to maintain it (unsustainable).
Strategic path was $82K at 40 hours weekly—revenue masked the drift.
The compounding pattern:
Small compromises → gradual drift → adapting to the drifted state → months pass → painful realization → massive course correction.
How monthly audits break it:
Measure monthly → spot drift at 5–10% → course-correct immediately → maintain strategic alignment → compound growth instead of compound drift.
The remaining question is whether 45 minutes a month is worth trading for avoiding the average $113,000 price tag of unmeasured strategy drift.
Monthly Drift Audits vs Quarterly Strategy Reviews
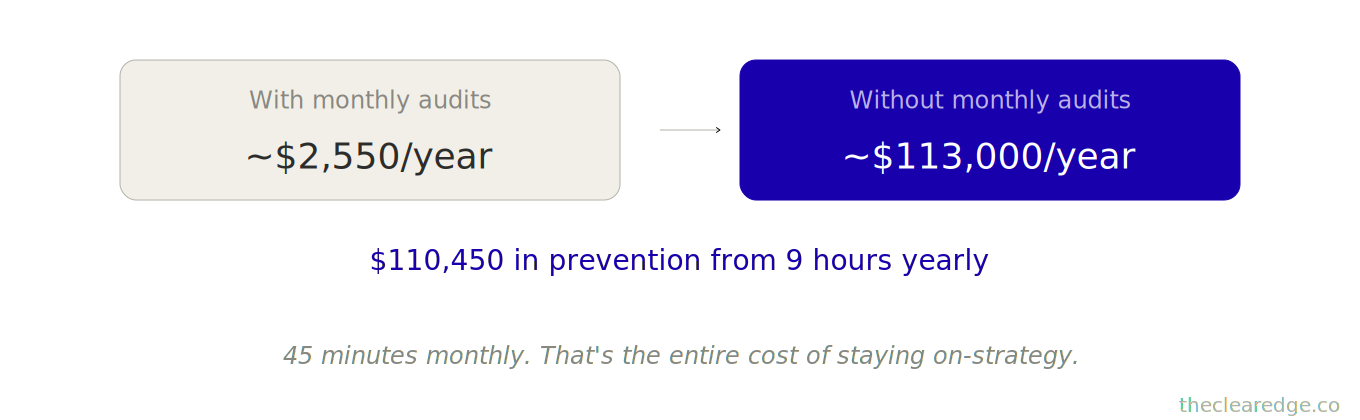
With Monthly Drift Audits:
Monthly drift audits cost 45 minutes per month.
That’s 9 hours yearly at $1,350.
Add 2 minor course corrections yearly (8 hours) at $1,200.
Total with audits: $2,550 annually.
Without Monthly Drift Audits:
Average drift runs about 7.3 months before anyone notices, by which point you’re roughly 32% off-strategy.
Course correction takes 3.8 months, costing $24,000 in time.
Opportunity cost during drift averages $89,000.
Total without audits: $113,000.
Net value of monthly audits : $110,450 in prevention.
If you’re already running at $60K–$90K/month, that $110,450 isn’t upside—it’s the silent tax you pay for not installing a simple Monthly Drift Audit.
When Drift Becomes Your Default
If you’re sitting at $60K–$90K/month, ignoring monthly drift audits is how you quietly trade $98K–$113K for a model you didn’t actually choose; start protecting 45 minutes instead.
Run the Monthly Drift Audit Sanity Check Checklist
Last Friday of every month, run this 45‑minute pass before you plan another “on‑strategy” quarter.
☐ Scored all six drift dimensions green/yellow/orange/red and wrote your total Drift Score out of 18 in your Monthly Drift Log.
☐ Calculated this month’s dollar drift by comparing strategic target (like $82K) to actual (like $68K) and wrote the $8K–$14K monthly gap.
☐ Matched your Drift Score to the 4/8/16‑hour correction ladder and blocked the exact course‑correction block you owe in the next 7 days.
☐ Listed the 3–5 root‑cause compromises driving drift (clients, time, offers, pricing, systems) and wrote one concrete reversal move for each.
☐ Logged cumulative drift cost vs. the $89K–$113K benchmark so you see whether you’re compounding toward Alicia’s $98K bill or away from it.
Forty‑five focused minutes here is what stops the quiet $8K–$14K/month drift tax from snowballing into the next $89K–$113K forced reset.
Where to Go From Here: Install the Monthly Drift Audit and Close the Strategy–Execution Gap
At $60K–$90K/month, every month you run without this 45-minute drift audit, you’re quietly accepting the $8K–$14K monthly strategy drift cost that turned Alicia’s planned $82K model into a stuck $68K reality and a $98K drift bill.
From here, install the Monthly Drift Audit as core infrastructure, not a nice idea:
Build your six-dimension strategic baseline once in 2 hours, so client mix, time, revenue mix, pricing, offers, and systems all have hard numbers instead of vibes.
Block a last‑Friday, 45‑minute slot and run the full six‑dimension audit → Drift Score → 3+ point trigger every month, catching drift at 3–8% in about 1.4 months instead of 32% drift after 7.3 months.
Match your course correction time to drift severity—4, 8, or 16 hours—so you trade roughly 9 hours of audits and a handful of focused sessions for preventing around $89K–$113K in strategy drift costs each year.
That’s how this small, repeatable audit stops “we’re basically on track” from quietly becoming another $8K–$14K/month gap and keeps your $60K–$90K model aligned with the strategy you actually chose instead of the one drift builds for you.
FAQ: Using the Monthly Drift Audit System at $60K–$90K/Month
Q: How do I know if I need the Monthly Drift Audit at $60K–$90K/month?
A: You need it when you’re at $60K–$90K/month, working close to 120 hours of capacity, and your actual client mix, pricing, and time allocation no longer match the strategy you wrote even though revenue looks “stable” at numbers like $68K.
Q: How much does unmeasured strategy drift really cost founders at this stage?
A: Unmeasured drift typically burns $8K–$14K in monthly opportunity cost, which compounds into about $89K–$98K over 7–8 months before most founders even notice something is off.
Q: How does the Monthly Drift Audit prevent the $98K drift bill described in this article?
A: By running a 45-minute last-Friday audit across six dimensions, it catches 3–8% drift within about 1.4 months so you can course-correct in 18 days instead of discovering a 32% off-strategy model after 7.3 months that requires a 3.8-month overhaul and costs roughly $89K–$98K.
Q: How do I use the Monthly Drift Audit with its six-dimension Drift Score before I plan my next quarter?
A: You compare your strategic baseline to current reality for client mix, time allocation, revenue mix, pricing, offer complexity, and system compliance, score each dimension green/yellow/orange/red, convert that to 0–18 drift points, and if you hit 3+ points you immediately schedule a 4–16 hour course correction session within 14–48 hours depending on severity.
Q: What happens if I keep relying on quarterly strategy reviews instead of running this every month?
A: Quarterly reviews usually detect drift after 6–12 months when you’re 15–25% off-course, which turns small 1–2% monthly deviations into a 20–40% gap, demands 3.8 months of correction time, and produces average opportunity costs around $89,000 instead of the $11,000 average when drift is caught monthly.
Q: How did Alicia’s Monthly Drift Audit turn a stuck $68K reality into an $82K strategic model?
A: After 7 months stuck at $68K with 14 clients and 126 hours of work, her first 45-minute audit showed 43% off-strategy client mix, 38% of time on non-strategic work, and a 7.2/10 severe drift score; she then transitioned out 4 mid-market clients over 60 days, raised remaining mid-market to $2,400, added 2 high-ticket clients, and by month 13 was at $82K on-strategy with sustainable 40-hour weeks.
Q: How do I interpret my Drift Score and decide which course correction protocol to use?
A: A total of 0–2 points means excellent alignment with no correction needed, 3–5 points calls for a 4-hour half-day session within 14 days, 6–9 points requires an 8-hour full-day reset within 7 days, and 10+ points triggers a 16-hour two-day overhaul within 48 hours plus 60 days of weekly monitoring.
Q: How much time does the Monthly Drift Audit actually take compared to the value it protects?
A: It takes about 2 hours one-time to set a strategic baseline, then 45 minutes on the last Friday of each month plus occasional 4–16 hour corrections, totaling roughly 9 hours a year of audits and a few extra sessions in exchange for about $89K–$110K in prevented opportunity cost.
Q: What specific drift patterns does this audit surface that founders usually miss?
A: It exposes patterns like client mix sliding from 100% high-ticket to mixed models, strategic time dropping from 10–12 planned hours to 3–5 actual hours, offer count creeping from 1 to 4, and system compliance falling from 90% to 10%, all while revenue numbers like $68K make everything look fine.
Q: Why does skipping monthly drift audits keep founders stuck paying the $8K–$14K monthly “drift tax”?
A: Because without monthly measurement you adapt to each small compromise, let 2–3% monthly deviation accumulate into a 20–40% gap over 6–12 months, and only realize the problem once you’ve racked up around $98K of missed $14K-per-month upside and now need months of disruptive correction instead of an 18-day fix.
⚑ Found a Mistake or Broken Flow?
Use this form to flag issues in articles (math, logic, clarity) or problems with the site (broken links, downloads, access). This helps me keep everything accurate and usable. Report a problem →
› More to Explore: Quick Navigation · Monthly Rituals
➜ Help Another Founder, Earn a Free Month
If this system just saved you from losing $89K–$110K to invisible strategy drift, share it with one founder who needs that relief.
When you refer 2 people using your personal link, you’ll automatically get 1 free month of premium as a thank-you.
Get your personal referral link and see your progress here: Referrals
Get the Monthly Drift Audit Implementation Toolkit
You’ve read the system. Now implement it.
Premium gives you:
Ready-to-use PDF toolkit—every template, diagnostic, and formula pre-filled, zero setup, immediate use
Plug-and-play AI diagnosis sessions—drop into Claude, Gemini or ChatGPT, answer a few questions, save hours of guessing, get your exact next move
Audio key points—concentrated frameworks you can absorb in minutes, implement while you move
Unrestricted access to the complete library—every system, every update
What this prevents: Another $98,000 drift bill from letting a $14K monthly strategy gap run for 7 months.
What this costs: $12/month. The templates you need to turn this Monthly Drift Audit from an article into a recurring last-Friday ritual are included.
Download everything today. Implement this week. Cancel anytime, keep the downloads.
Already upgraded? Scroll down to download the PDF, audio, and your AI session.
