
The Monthly Cash Flow Reality: The 45-Minute Ritual That Frees $12K–$18K in Trapped Cash Every Year
A 45-minute Monthly Cash Flow Reality diagnostic for $90K–$110K/month founders that measures cash collection, surfaces timing lags, and turns invisible cash traps into deployable capital each month.


The Executive Summary
Founders at $90K–$110K risk losing $12K–$18K in trapped capital every year by tracking revenue instead of cash; a 45-minute Monthly Cash Flow Reality diagnostic turns invisible cash lags into deployable capital.
Who this is for: Founders and operators at $90K–$110K/month who feel cash-poor despite revenue growth and suspect money’s stuck in terms, processing delays, or refunds.
The cash flow reality problem: A recurring 23–28% gap between recorded revenue and collected cash quietly traps $20K–$30K at any time and compounds into $12K–$18K in missed annual capital deployment.
What you’ll learn: How to run the Monthly Cash Flow Reality (45-Minute Diagnostic), calculate your cash collection rate, use invoice aging analysis and payment method analysis, and plug refund leaks that destabilize cash.
What changes if you apply it: You avoid discovering a $147,000 cash lag after 7.2 months and a $17,640 opportunity cost, instead lifting collection from 71% to 89–94% and freeing capital for hires, product, and acquisition.
Time to implement: The diagnostic takes 45 minutes on the last Friday of each month, with 2–4 hours of one-time setup and 3–4 weeks to see the first $12K–$18K in freed, redeployed cash.
Written by Nour Boustani for $90K–$110K/month founders who want to free trapped cash and deploy it for growth without missing six-figure capital opportunities.
Cash‑poor at $90K–$110K because revenue and cash don’t match and the Monthly Cash Flow Reality isn’t installed yet? Close that gap with real numbers and clear moves—upgrade to premium.
› Library Navigation: Quick Navigation · Monthly Rituals
The Cost of Skipping Monthly Cash Flow Analysis at $90K–$110K/Month
Sofia, a SaaS founder, is running at $97K per month and still feels broke.
Cash flow issues don’t show up on her dashboard—revenue looks healthy, but the bank balance stays tight and she can’t explain the gap.
If this is caught monthly, it’s fixable; if it’s only caught when she can’t make payroll, that’s $12K–$18K that’s been quietly locked away as trapped capital.
Here’s what that looks like in real numbers:
Revenue is growing steadily at $97K this month and $102K projected next month.
The bank account tells a different story: she couldn’t invest in the contractor she needed.
She also couldn’t prepay the annual software for a 20% discount, leaving $4,800 on the table; the dashboard looked strong, but her account felt tight.
There was no monthly cash flow analysis—only revenue tracking—so she assumed revenue meant available cash.
But reality:
Month 7 revenue: $97,000
Month 7 cash collected: $71,400 (actual deposits)
Gap: $25,600 (earned but not received)
Where was the money?
$18,200 in unpaid invoices (clients on 30-60 day terms)
$4,800 in payment processing delays (Stripe holds, ACH timing)
$2,600 in pending refunds/credits (hadn’t been processed yet)
The cash existed. On paper. Not in her account.
Month 8: Started monthly cash flow analysis. First analysis (45 minutes) revealed:
Revenue vs. Cash Pattern (Last 6 Months):
Average monthly revenue: $94,000
Average monthly cash collected: $68,200
Average gap: $25,800 (27% of revenue not accessible)
Hidden Cash Traps Found
Trap 1: Invoice Terms Creating 45-Day Delay
12 of 23 clients on Net-30 terms (52% of clients)
Average invoice $4,200
Payment arrival: 37 days actual (not 30)
Cash trapped: 12 clients × $4,200 × 1.23 months delay = $61,992 constantly outstanding
Trap 2: Annual Contracts Paid Monthly
8 annual clients ($36,000 yearly value each)
Paid monthly ($3,000 × 12)
Cash timing: Delivers 12 months value upfront, receives payment over 12 months
Opportunity cost: Could’ve had $288,000 upfront vs. $24,000/month — $264,000 of capital unavailable for deployment.
Trap 3: Payment Processing Holds
Stripe 7-day rolling reserve on new transactions
Monthly processing: $97,000
Always $22,575 held in reserve (7/30 of monthly revenue)
Not accessible despite being “earned”
Trap 4: Subscription Churn Refunds
3-4 refunds monthly (cancellations within refund window)
Average $1,800 per refund
Revenue recorded, then reversed
Cash impact: $5,400–$7,200 monthly negative adjustment
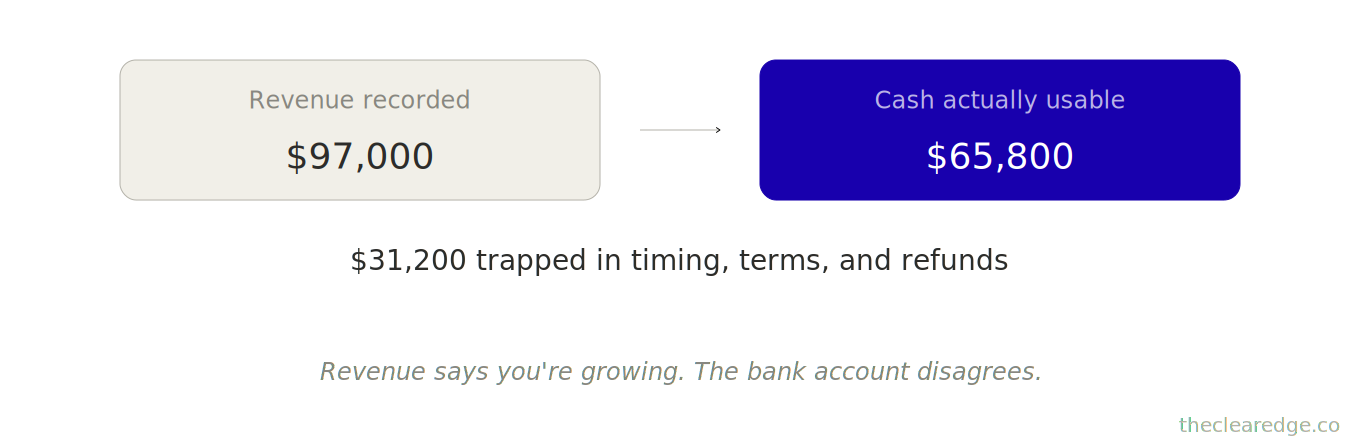
Total Cash Reality:
Revenue recorded: $97,000
Cash actually available: $97,000 - $25,800 timing gap - $5,400 refunds = $65,800
Usable cash: 68% of revenue
Month 8-9: Made four immediate changes based on analysis.
Change 1: Shifted 8 Clients to Upfront Annual Payment
Offer: Pay annually, get 2 months free (17% discount).
Result:
5 of 8 accepted (63% conversion)
Immediate cash: 5 × $30,000 = $150,000 lump sum (vs. $15,000 monthly)
$135,000 capital is immediately accessible
Trade-off: $60,000 revenue foregone (2 months free × 5 clients × $3,000/month) for $135,000 cash timing improvement
Net: $75,000 more cash available immediately — invested in a contractor ($6,000/month) who shipped a feature generating $8,000/month in new upgrades.
Change 2: Moved 6 Net-30 Clients to Credit Card Payment
Offer: Switch to card, get 3% discount ($126 monthly savings on $4,200 invoice).
Result:
4 of 6 accepted (67% conversion)
Cash timing: 37 days → 2 days
Freed: 4 × $4,200 × 1.17 months earlier → $19,656 cash accelerated
Cost: $504 monthly in discount (4 × $126)
Value: $19,656 deployed into ad spend testing → $7,200 monthly new revenue (sustained)
ROI: $7,200 monthly revenue gain for $504 monthly discount → 14.3x return.
Change 3: Implemented 7-Day Payment Terms
New client contracts: Payment due within 7 days vs. 30 days
Existing clients: Grandfathered (didn’t change mid-contract)
Result:
All new clients (3 in month 9): 7-day terms
Cash arrival: 9 days actual (very fast)
3 × $4,200 = $12,600 received in 9 days vs. 37 days previously
Freed: $12,600 × 0.93 months earlier → $11,718 cash acceleration
Change 4: Refund Prevention System
Analyzed refund patterns and found 80% of refunds came from clients who didn’t complete onboarding within 14 days of purchase.
Solution: Added mandatory 48-hour onboarding call + 7-day activation checklist.
Result:
Refund rate: 3.6% → 1.4% (61% reduction)
Refunds prevented: $3,780 monthly (2.2 refunds × $1,800 average)
Cash stability: $45,360 annually, no longer reversed
Combined Cash Flow Impact
Month 10 Reality:
Revenue: $105,000 (growth from contractor’s work)
Cash collected: $97,300 (93% vs. previous 68%)
Improvement: a 25‑percentage‑point increase, yielding $26,250 more usable cash from the same revenue.
Month 12 Reality:
Revenue: $111,000
Cash collected: $104,700 (94%)
Freed capital deployed: $166,374 total ($135,000 annual payments + $31,374 faster terms).
Return on freed capital:
Contractor feature ($8,000 monthly) +
Ad testing ($7,200 monthly)
Total return on freed capital: $8,000 + $7,200 = $15,200/month
Annualized: $15,200 × 12 = $182,400/year
ROI: 107% annual return ($182,400 a year on $166,374 deployed + $6,048 in discounts).
Cost of not running a monthly cash flow analysis:
Period without analysis: 6 months
Average revenue trapped: 27% of revenue = $25,800/month
Total trapped capital: $25,800 × 6 = $154,800
Potential annual return at 12%: $18,576/year on $154,800 trapped (at 12%).
The issue isn’t that revenue grows—it’s that cash flow quietly lags behind it.
By the time you notice you can’t invest, can’t hire, and feel broke despite strong revenue, you’ve already had 6–12 months of trapped capital.
Monthly cash flow analysis shifts timing:
Catch 27% cash lag in month 1 → fix payment terms, free capital.
Catch it in month 8 → $154,800 was trapped for 8 months while opportunities passed.
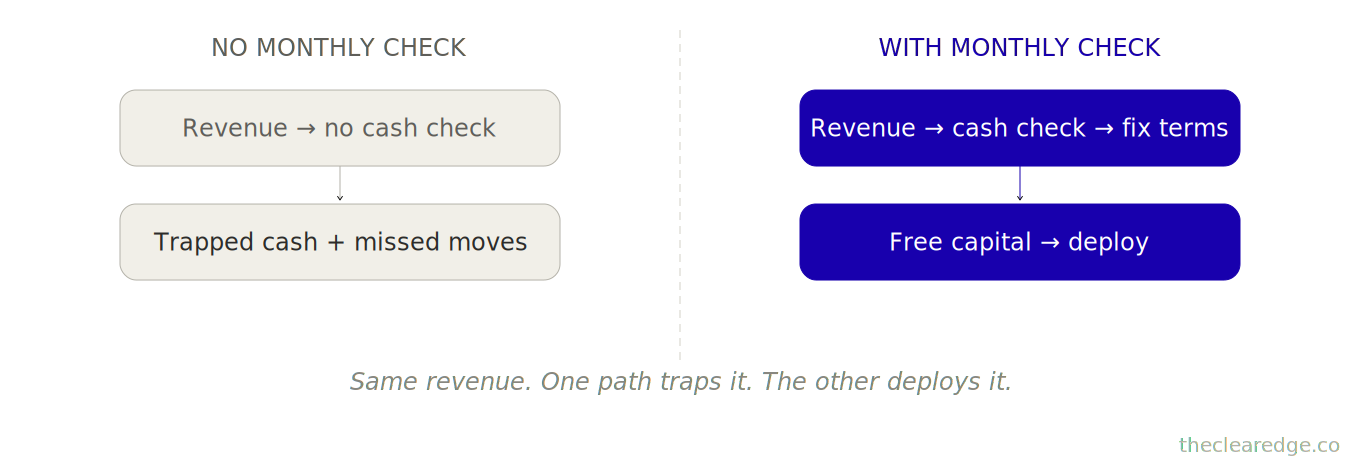
When the 27% lag shows up in month 1 instead of month 8, the same $94,000 revenue suddenly behaves like a funding engine instead of a slow-motion cash drain.
Cash Lag Pattern at $90K–$110K/Month: How Revenue Masks Trapped Operating Cash
Now that you’ve seen how one undetected 27% cash lag can cost $154,800 in trapped capital, here’s why every operator needs this monthly.
Revenue growth masks cash flow problems: the revenue chart goes up and to the right, but the bank account stays flat or creeps up slowly, so you feel confused—you’re doing well, but you still can’t deploy capital.
At $90K-$110K/month:
Average 23-28% gap between revenue and collected cash
Common traps:
Invoice terms (30-60 days)
Annual contracts paid monthly
Payment processing delays
Refunds
Typical trapped capital: $20K-$30K at any moment
The compounding problem:
Can’t invest trapped capital.
Miss contractor hire ($8K/month value).
Can’t prepay software ($4,800 savings).
Can’t test ads ($7,200/month revenue potential).
Opportunities pass. Trapped cash leads to trapped growth.
Across 68 operators I’ve tracked who skip monthly cash flow analysis vs. those who run it consistently:
Without a monthly cash flow analysis:
Average cash collection rate: 71% of revenue (rest trapped in timing)
Average time to discover cash lag: 7.2 months
Average trapped capital at discovery: $147,000
Average opportunity cost: $17,640 annually (12% return on trapped capital)
With monthly cash flow analysis:
Average cash collection rate: 89% of revenue
Average time to discover cash lag: 1.1 months
Average trapped capital after fixes: $31,000
Average opportunity cost: $3,720 annually
Difference: $13,920 annually in freed capital deployment opportunities.
The critical insight most founders miss: revenue and cash aren’t the same thing.
Revenue = you’ve earned it.
Cash = you can use it.
The gap between earning and using can be 30–60 days with traditional invoicing, and up to 12 months with annual contracts paid monthly.
Without monthly measurement, that gap stays invisible, so it feels like “business is good but money’s tight,” and you can’t pinpoint why.
Monthly analysis reveals exactly where $20K–$30K is trapped and how to free it.
[Cash Collection Rate Pattern]

No Monthly Analysis:
Revenue ------>
   Cash ---->

With Monthly Analysis:
Revenue ------>
   Cash ---------->
Monthly Cash Flow Reality: 45-Minute Diagnostic for Trapped Cash at $90K–$110K/Month
This isn’t revenue tracking; it’s a cash‑timing analysis.
Measure the gap between revenue earned and cash collected.
Find trapped capital.
Fix payment terms.
Deploy freed cash.
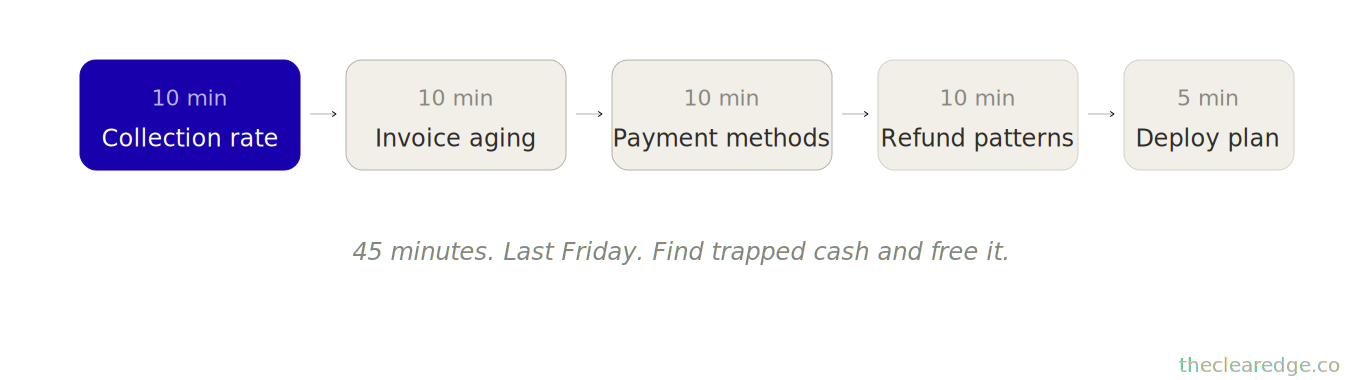
Run this last Friday of every month. 45 minutes. Permanent.
Step 1: Calculate Your Cash Collection Rate (10 minutes)
Pull three numbers from last month:
- Revenue recorded (from accounting): $_____
- Cash collected (actual bank deposits): $_____
- Gap: Revenue - Cash = $_____
- Cash collection rate: (Cash ÷ Revenue) × 100 = _____%
Benchmarks:
90-100%: Excellent (cash flowing immediately)
80-89%: Good (minor timing lag)
70-79%: Concerning (significant lag, money trapped)
<70%: Critical (major cash flow problem)
Your rate: _%
If below 85%: Proceed to Steps 2-4 to find where cash is trapped.
Step 2: Invoice Aging Analysis to Find Trapped Cash in Overdue Receivables
Calculate totals:
- 0-15 days outstanding: $_____ (current)
- 16-30 days outstanding: $_____ (standard)
- 31-60 days outstanding: $_____ (aging)
- 60+ days outstanding: $_____ (problem)
- Total outstanding: $_____
- Average days to payment: (Sum of all days outstanding ÷ Number of invoices) = _____ days
What this reveals:
If average days are over 30, your payment terms are too generous or your collection enforcement is weak.
If the 60+ days bucket is more than 20% of total outstanding, you have a collection problem that needs immediate action.
- Trapped capital in invoices: Total outstanding $_____

- Opportunity cost:
  $_____ × 12% annual return ÷ 12 months
  = $_____ monthly opportunity cost
Step 3: Payment Method Analysis to Reduce Cash Collection Delays
Calculate weighted average delay:
Weighted average delay:

- Method 1: revenue $_____ × delay _____ days
- Method 2: revenue $_____ × delay _____ days
- Method 3: revenue $_____ × delay _____ days

Total weighted delay:
( $_____ + $_____ + $_____ ) ÷ total revenue $_____ = _____ days average
What this reveals:
High percentage on Net‑30/60 or annual‑paid‑monthly means a significant timing lag in cash collection.
Action: Calculate potential cash acceleration if you move 20% of invoice clients to credit card.
- Current invoice revenue on Net-30: $_____
- × 20% = $_____
- × Average 35-day acceleration (37 days - 2 days) = $_____ × (35/30) months earlier
- = $_____ cash freed

Worth offering a 2-3% discount to accelerate?
- Discount cost: $_____ × 2.5% = $_____
- Cash acceleration value: $_____

If cash acceleration > 10× discount cost, worth it.
Step 4: Refund Pattern Analysis to Stabilize Monthly Cash Flow
Average monthly refund rate: _____%
Benchmarks:
<2%: Excellent
2–4%: Normal
4–6%: Concerning (product–market fit or expectation issue)
>6%: Critical (major problem)
Your rate: _%
If above 3%: Analyze refund reasons. Look for a pattern.
Common patterns:
Refunds within 14 days: Onboarding failure
Refunds at 30–60 days: Value delivery failure
Refunds from specific client type: Targeting misalignment
Preventable refunds: If a pattern is found, estimate the prevention:
Current refund rate:
Target refund rate (with fix): %
Monthly revenue: $
Refunds prevented: (Current % − Target %) × Revenue = $
Annual cash stability from refund prevention: $_ × 12 = $_
Step 5: Cash Deployment Plan for Newly Freed Operating Capital
Based on the analysis, you now know:
- Cash collection rate: _____%
- Trapped capital amount: $_____
- Primary trap location: _____ (invoices, payment methods, refunds)
- Potential freed capital: $_____
Deployment options for freed cash:
Option 1: Hire a contractor/VA to free your time
- Cost: $_____/month
- Time freed: _____ hours/month
- Value: _____ hours × $_____/hour rate = $_____/month capacity
Option 2: Prepay annual software for a discount
- Annual cost: $_____
- Discount: _____%
- Savings: $_____
- Effective return: _____% (discount % × 12 months)
Option 3: Test paid acquisition channel
- Monthly test budget: $_____
- Expected ROAS: _____× (return on ad spend)
- Projected revenue: $_____ × _____ = $_____/month
Option 4: Build cash reserve (3 months operating expenses)
- Monthly expenses: $_____
- Target reserve: $_____ × 3 = $_____
- Current reserve: $_____
- Gap: $_____
- Your priority: _____ (choose based on current constraint)
This diagnostic reveals where cash is trapped and quantifies deployment value.
Three Cash Flow Moves to Convert Diagnostic Insights into Deployed Capital
Monthly cash flow analysis reveals the gap, and most founders stop there—here’s how to actually free trapped capital and put it to work.
Move 1: Fix Payment Terms to Shorten Cash Collection Cycles
Your task is to review current payment terms across all revenue streams and identify where you can accelerate cash without losing clients.
Standard Terms Ladder:
Credit card: immediate – 2 days
ACH: near‑immediate – 3–5 days
Net‑7: fast – 9–12 days actual
Net‑15: reasonable – 18–21 days actual
Net‑30: slow – 35–40 days actual
Net‑60: very slow – 65–70 days actual
Each step up the ladder gives you 15–25 days of cash acceleration.
Action Steps
For new clients:
Set default terms: credit card or Net‑7
Only offer Net‑30 if the client requires it (large company procurement)
Build this into the contract template now (affects all future deals)
For existing clients on Net‑30/60:
Offer an incentive to switch: 2–3% discount for credit card payment
Calculate: is 2–3% discount worth a 30‑day cash acceleration?
Formula: trapped capital × 12% annual return ÷ 12 months = monthly opportunity cost
If monthly opportunity cost > discount cost, offer it
Example:
Client pays $5,000 monthly on Net-30 (37 days)
Switching to credit card (2 days) accelerates cash by 35 days
Trapped capital freed:
$5,000 × (35 ÷ 30) = $5,833
Opportunity cost of 35-day delay:
$5,833 × 12% ÷ 12 = $58 monthly
Discount cost for credit card:
$5,000 × 2.5% = $125 monthly
In this case, the discount costs more than the opportunity value. Don’t offer.
But: If you have 10 clients at $5,000 each on Net-30:
Total trapped = $58,330
Opportunity cost = $583 monthly
If 4 accept the discount:
Discount cost = $500 monthly
Capital freed = $23,332
Worth it.
Sofia’s example:
Offered 3% discount to 6 Net-30 clients for card payment. 4 accepted.
Cost:
4 × $4,200 × 3% = $504 monthly
Capital freed:
4 × $4,200 × 1.17 months earlier = $19,656
Deployment:
Deployed freed capital into ads → generated $7,200 monthly new revenue
Net ROI:
($7,200 − $504) ÷ $504 ≈ 13.3x return
Time investment: 2 hours to analyze, draft an offer, and send to clients. Permanent improvement.
That kind of 13.3x payoff on a small discount is what happens when the cash timing math from the diagnostic directly informs the terms you’re willing to trade.
Move 2: Implement Annual Prepayment Options for Recurring Revenue Clients
Your task is to offer subscription or retainer clients an annual prepayment option with a discount—trading a modest amount of revenue for immediate cash.
Standard Annual Discount Formula
What you do:
Offer 1–2 months free when paid annually (8–17% discount).
Example math:
$3,000 monthly = $36,000 annually.
Discount: 2 months free → pay $30,000 for 12 months (17% discount).
Why clients accept:
Save $6,000 (17%), lock in price (no increases), and cut admin (one payment vs. 12).
Why you benefit:
$30,000 cash immediately vs. $3,000 × 12 months = $27,000.
Capital is available 6 months earlier on average; the value of early capital is greater than the discount given.
Action Steps:
Identify subscription/retainer clients (recurring monthly).
Calculate offer: monthly × 10 or 11 (1–2 months free).
Draft email with three benefits: savings, price lock, simplicity.
Send to all eligible clients.
Track acceptance rate.
Expected conversion: 40-60% of clients accept annual payment when offered.
Cash impact calculation:
- Current monthly recurring: $_____
- Eligible clients: _____
- Expected conversions (50%): _____
- Immediate cash: _____ clients × $_____ annual = $_____
- Foregone revenue (discount): _____ clients × $_____ discount = $_____
- Net cash freed: $_____ - $_____ = $_____
Deployment: Use freed cash for a one-time investment with permanent return (hire, build, acquire).
Sofia’s example:
Offered annual payment to 8 monthly clients ($3,000/month each, 2 months free). 5 accepted (63%).
Immediate cash:
5 × $30,000 = $150,000
Foregone revenue:
5 × $6,000 = $30,000
Net freed:
$120,000 immediately available
Deployed:
$72,000 into a contractor who built a feature generating $8,000 monthly, ongoing
ROI
Annual return: $96,000
Capital invested: $72,000
Plus revenue discount: $30,000
Effective annual return: 94%
Time investment
Total: 4 hours
Tasks:
Design the offer
Write the email
Create the payment links
Follow up
Move 3: Install a Refund Prevention System to Reduce Cash Reversals
Your task is to analyze refund patterns, find the common trigger, and build a prevention step into the client journey.
Common Refund Triggers:
No onboarding: 78% of early refunds
Client buys, doesn’t start, requests a refund within 14 days
Prevention: Mandatory onboarding call within 48 hours of purchase
Wrong-fit client: 64% of 30-60 day refunds
Client doesn’t match the ideal profile, realizes later, leaves
Prevention: Qualification before purchase (application or consultation)
Unmet expectations: 52% of 60-90 day refunds
The client expected faster results or a different outcome
Prevention: Realistic timeline + milestone communication
Action Steps
Week 1: Analyze
Pull all refunds from the last 6 months
Note: Days from purchase to refund request, stated reason, client type
Find pattern (most refunds happen at _ days, reason: _)
Week 2: Design Prevention
Based on pattern, build appropriate intervention:
Early refunds (0-14 days): Add onboarding requirement
Mid refunds (30-60 days): Add qualification step
Late refunds (60-90 days): Improve expectation-setting
Week 3: Implement
Add a prevention step to the sales process
Brief the team on the new process
Monitor refund rate for the next 90 days
Expected reduction: 40-60% of refunds preventable with a single intervention
Cash stability calculation:
- Current monthly refund cost: $_____
- Target reduction: 50%
- Monthly cash saved: $_____ × 50% = $_____
- Annual cash stability: $_____ × 12 = $_____
Sofia’s example:
Found 80% of refunds from clients who didn’t complete onboarding within 14 days.
Added: mandatory 48-hour onboarding call + 7-day activation checklist.
Refund rate: 3.6% → 1.4% (61% reduction).
Monthly refunds prevented: $3,780.
Annual cash stability: $45,360 (money that stays collected vs. reversed).
Time investment: 6 hours to analyze patterns, design intervention, and implement process change. Permanent improvement.
Once these payment term fixes are in place, every new $90K–$110K month automatically runs through a cleaner cash path instead of recreating the same lag.
What Operators Miss When They Track Revenue But Skip Monthly Cash Flow Analysis
Running a monthly cash flow analysis reveals gaps operators miss when they only track revenue.
[Revenue vs Cash Reality]

- Revenue:$97K Earned
- Cash:$71K Available
- Gap:$26K Timing + Refunds
Revenue doesn’t equal cash: the revenue chart shows $97K while the bank account shows $71K, leaving you wondering where the missing $26K went.
Without monthly analysis, that gap stays mysterious; monthly tracking reveals exactly where it’s trapped in invoices, processing delays, and pending refunds.
Payment Terms Drain: Net-30 feels standard. “Everyone does it.”
Reality:
37 days actual vs. 2 days for card.
This creates $19,656 trapped per client at any moment for a $4,200 monthly client.
Four clients represent $78,624 that stays constantly unavailable.
Monthly analysis makes invisible costs visible.
Annual Contract Paradox: Annual contracts feel great (recurring revenue, retention).
Paid monthly?
Deliver 12 months of value upfront
Receive payment over 12 months
$288,000 in value delivered, only $24,000 cash monthly
Without analysis, it doesn’t register as trapped capital.
Monthly tracking shows opportunity: Offer an annual payment for a discount, free $264,000 capital.
Small Refund Rate Compounds: The 3.6% refund rate feels minor.
Monthly revenue of $97K at a 3.6% refund rate comes to $3,492 per month, which feels acceptable.
Across a year, that becomes $41,904 in refunds that could likely be prevented with the right fixes.
Analyze pattern: 80% from no onboarding.
Fix: $25,632 annual stability.
Without monthly tracking, “minor” leaks compound invisibly.
Monthly Cash Flow Analysis vs Revenue-Only Tracking at $90K–$110K/Month
Monthly cash flow analysis: 45 minutes per month, 9 hours per year, $1,350
Finds trapped capital: Average $147,000
Deployment at 12% return: $17,640 in annual opportunity value
Revenue-only tracking costs $0 in time and misses cash lag averaging 7.2 months.
Opportunity cost: $17,640 annually in lost deployment returns.
Net value of monthly analysis: $16,290 prevention.
When Cash Lag Becomes Your Real Ceiling
If a 27% lag quietly traps $147,000 for 7.2 months, you’re not starved for revenue—you’re starving your own growth engine of cash; start fixing timing before you chase more top line.
Run the Monthly Cash Flow Reality Scorecard Checklist
Last Friday of every month, pull this before you trust any $90K–$110K revenue line.
☐ Calculated last month’s cash collection rate from revenue vs actual deposits and wrote the percentage against the 71% vs 89–94% benchmarks.
☐ Listed total outstanding invoices by aging bucket and wrote the dollar amount of trapped capital and its monthly opportunity cost at 12% annual return.
☐ Broke revenue down by payment method and logged your weighted average delay plus how much cash you’d free by moving 20% off Net‑30/60.
☐ Summed the last 3 months of refunds, wrote your average refund rate, and marked whether you’re under 2%, 2–4%, 4–6%, or over 6%.
☐ Wrote a one-move deployment plan for newly freed cash (hire, prepay, or ads) and logged the dollar amount you’ll put to work next month.
Forty‑five minutes here prevents the next $147,000 cash lag and $17,640 in lost returns from hiding under “good” revenue.
Where to Go From Here: Install the Monthly Cash Flow Reality and Turn Trapped Capital Into Working Cash
You’re running at $90K–$110K/month, and every month you skip this 45-minute diagnostic you’re quietly choosing the $12K–$18K trapped capital tax you just saw turn into a $147,000 cash lag and $17,640 in missed returns.
From here, make the Monthly Cash Flow Reality a fixed end‑of‑month ritual, not an ad‑hoc check:
Run the 5-step, 45-minute diagnostic on the last Friday of every month—cash collection rate, invoice aging, payment methods, refund patterns, and a concrete deployment plan.
Fix what the numbers reveal: tighten terms, shift more volume to faster payment methods, and install refund prevention so your cash collection rate moves from 71% toward 89–94%.
Treat every dollar of freed cash as fuel—deploy the $12K–$18K you unlock each year into hires, product, or acquisition instead of letting another $154,800 sit idle while your revenue line pretends everything is fine.
That’s how a recurring 45-minute checkpoint turns a “healthy” $90K–$110K revenue stream into a real funding engine and stops your growth from being capped by invisible timing lags instead of actual demand.
FAQ: Monthly Cash Flow Reality System for $90K–$110K/Month Founders
Q: How do I know if I need the Monthly Cash Flow Reality diagnostic at $90K–$110K/month?
A: You need it when revenue is around $90K–$110K/month but your bank balance feels tight, you’re delaying hires or a $4,800 software prepay, and you can’t clearly explain where $20K–$30K of “earned” money is stuck.
Q: How much hidden cash does the Monthly Cash Flow Reality typically uncover each year?
A: For founders at $90K–$110K/month, it routinely exposes a 23–28% gap between revenue and collected cash that traps $20K–$30K at any moment and compounds into $12K–$18K per year in missed capital deployment.
Q: How does the Monthly Cash Flow Reality prevent the $17,640 annual opportunity cost described in this article?
A: By running a 45-minute end-of-month diagnostic that flags a 27% cash lag in month one instead of after 7.2 months, you can free up to $147,000 in trapped capital and redirect it at a 12% annual return instead of losing $17,640 in opportunity every year.
Q: How do I use the Monthly Cash Flow Reality with its 45-minute five-step diagnostic before I make the next big hire or ad spend decision?
A: On the last Friday of the month, you calculate your cash collection rate, run invoice aging, payment method, and refund analyses, then build a cash deployment plan so any hire, contractor, or ad test you commit to is funded by freed capital instead of guessing from a misleading $90K–$110K revenue line.
Q: What happens if I keep tracking only revenue instead of cash flow at this stage?
A: You average a 71% cash collection rate, discover the lag after about 7.2 months when $147,000 is trapped, and quietly lose around $17,640 per year in returns you could have earned by deploying that capital earlier.
Q: How quickly can the Monthly Cash Flow Reality free usable cash if I implement the changes?
A: With 2–4 hours of one-time setup and a 45-minute monthly session, operators typically see the first $12K–$18K in freed, redeployed cash within 3–4 weeks as they tighten terms, shift clients to faster payment methods, and plug refund leaks.
Q: How much did Sofia recover by applying the Monthly Cash Flow Reality moves to her $97K/month SaaS?
A: She converted 5 of 8 annual clients to upfront payments for $150,000 cash, freed $19,656 by moving 4 Net-30 clients to card, cut refunds by $3,780 per month, and ended up deploying $166,374 of capital that generated $182,400 annually—a 107% yearly return.
Q: How do I interpret my cash collection rate once I calculate it with this system?
A: A 90–100% rate means cash is flowing immediately, 80–89% is acceptable with minor lag, 70–79% signals trapped money, and anything under 70% is a critical problem where a large share of your $90K–$110K revenue exists only on paper.
Q: How does shifting payment terms using this framework turn “standard” Net-30 into real cash?
A: By moving even 20% of Net-30 invoice volume to credit card or Net-7, you can accelerate roughly a 35-day delay, freeing tens of thousands of dollars—Sofia’s switch of 4 clients at $4,200 each freed $19,656 in cash that produced $7,200 in new monthly revenue at a 14.3x return.
Q: Why does skipping the Monthly Cash Flow Reality keep founders feeling cash-poor despite strong revenue growth?
A: Because a 23–28% cash lag hides inside normal-looking revenue charts for 6–12 months, creating situations where $94K–$111K in monthly revenue still translates into only 68–71% as usable cash, so you feel broke, delay growth moves, and quietly leave $13,920–$18,576 in annual opportunity on the table.
⚑ Found a Mistake or Broken Flow?
Use this form to flag issues in articles (math, logic, clarity) or problems with the site (broken links, downloads, access). This helps me keep everything accurate and usable. Report a problem →
› More to Explore: Quick Navigation · Monthly Rituals
➜ Help Another Founder, Earn a Free Month
If this system just saved you from losing $17,640 every year to invisible cash lags, share it with one founder who needs that relief.
When you refer 2 people using your personal link, you’ll automatically get 1 free month of premium as a thank-you.
Get your personal referral link and see your progress here: Referrals
Get the Monthly Cash Flow Reality Implementation Toolkit
You’ve read the system. Now implement it.
Premium gives you:
Ready-to-use PDF toolkit—every template, diagnostic, and formula pre-filled, zero setup, immediate use
Plug-and-play AI diagnosis sessions—drop into Claude, Gemini or ChatGPT, answer a few questions, save hours of guessing, get your exact next move
Audio key points—concentrated frameworks you can absorb in minutes, implement while you move
Unrestricted access to the complete library—every system, every update
What this prevents: Another $17,640 in yearly lost returns from letting a 27% cash lag run 7.2 months.
What this costs: $12/month. Implementation toolkit for Monthly Cash Flow Reality.
Download everything today. Implement this week. Cancel anytime, keep the downloads.
Already upgraded? Scroll down to download the PDF, audio, and your AI session.
