
The Five Numbers: The Metrics Behind Every $100K Month for $80K–$100K Operators
The Clear Edge OS Five Numbers Framework for $95K–$115K/month founders and operators: calculate 90-day baselines, find your single constraint, and run $150K+ decisions from a one-page dashboard.


The Executive Summary
$100K-month founders burn 9+ work weeks a year in dashboards that don’t change decisions while the Five Numbers Framework quietly decides whether they ever reach $150K+ months.
Who this is for: Founders and operators at $95K–$115K/month who track 15–25 metrics, spend 7.5 hours weekly in dashboards, and still can’t name the one lever for the next $20K–$40K/month.
The dashboard problem: An educator at $98K/month tracked 23 metrics for 390 hours yearly and stayed flat 7 months, while a $104K/month service business lost $18K chasing 17 metrics instead of a 42% → 31% conversion drop.
What you’ll learn: The Five Numbers Framework—Lead Flow, Conversion Rate, Average Transaction Value, Client Retention, Delivery Capacity—and a three-move process to pull your last 90 days, find one constraint, and set a 15–35% 90-day target.
What changes if you apply it: You run the business from a one-page dashboard, free 7+ hours weekly, and make moves like $5,200 → $7,500 pricing or 22% → 31% conversion that drive shifts like $94K → $121K or $108K → $149K in 90 days without more leads.
Time to implement: A 3–4 hour one-time build for your five-number tracker, then 10–30 minutes monthly to maintain it, freeing 364+ hours a year and putting your next $20K–$50K/month inside fixing one real constraint instead of chasing vanity metrics.
Written by Nour Boustani for $95K–$115K/month founders and operators who want $150K+ revenue decisions from five numbers—not 23, not 17—without spending 9 work weeks a year staring at dashboards that don’t move the needle.
If your dashboard tracks 17–23 metrics and you still can’t see the next $20K–$40K/month, you’re in the Dashboard Problem; upgrade to premium and build the Five Numbers Framework tracker that turns one constraint into your 90-day focus.
› Library Navigation: Quick Navigation · The Clear Edge OS
The Dashboard Problem: When 17–23 Metrics Hide The Real Revenue Constraint At $100K Months
Seventeen metrics stare back from your dashboard, and none of them tell you what to do next.
Traffic, followers, opens, clicks—everything is moving, but the one bottleneck that actually decides whether you ever move past $100K/month stays buried.
You check the same numbers today, then tomorrow, then the next day, hoping the dashboard will suddenly show you the real constraint.
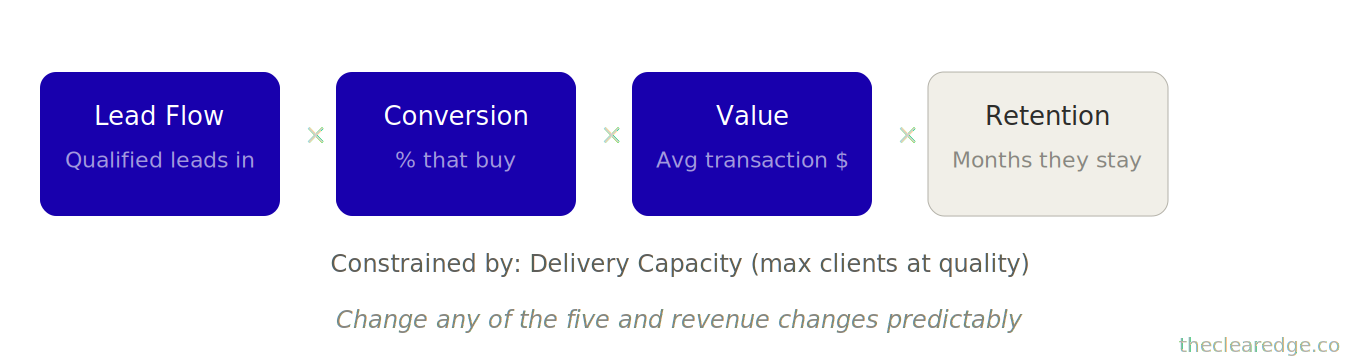
At $100K/month, only five numbers actually matter: lead flow, conversion rate, average transaction value, client retention, and delivery capacity.
Everything else is derivative or distraction, and when you track only those five, the path to $150K finally shows up.
Those five numbers are the pattern, but you also need to see how they behave across 42 businesses before you decide which one to move first.
Five Numbers Pattern At $95K–$115K Months: Three Dashboard Failure Modes For Operators
Across 42 businesses audited at $95K–$115K monthly, here’s what shows up:
The metric collector
Founder tracks 15–25 metrics and reviews dashboards daily, but still can’t identify which number to improve first. Analysis paralysis hides behind the idea of “being data-driven,” so decisions stall while dashboards stay open.
The vanity tracker
Founder watches follower count, engagement rate, and email list size climb while revenue stays flat. These feel-good metrics look impressive on screen, but they don’t connect to money or change what the business earns.
The gut operator
Founder ignores all metrics and makes decisions by feel, then wonders why growth stalled. It’s flying blind, then labeling the guesswork as intuition.
All three patterns share the same outcome: revenue plateaus because the founder doesn’t know which lever to pull.
Case: Service business at $104K/month
A founder spent three weeks “analyzing why growth stalled,” building spreadsheets, comparing quarters, and studying trends, but all that work circled the problem instead of naming it.
Lead-to-client conversion had quietly dropped from 42% to 31%, and that single number explained the entire plateau.
Because it was buried under seventeen other metrics that all looked fine, he didn’t spot it until $18K in potential revenue had already leaked—time spent analyzing noise instead of fixing the signal.
Here’s what fixes it.
Nine Work Weeks Or One Tracker Choice
If 9.75 work weeks in dashboards and leaks like $18K sound familiar, upgrade to premium for the layer that installs a single Five Numbers Framework tracker instead of seventeen distractions.
Five Numbers Framework For $100K–$150K: Core Metrics For Operator Revenue Decisions
At $100K/month, your entire revenue engine runs on five metrics—not seventeen, not twenty‑three.
Track these five and make decisions from them, and ignore everything else (or delegate someone else to keep an eye on it).
Number 1: Lead Flow
How many qualified leads entered your business this month?Number 2: Conversion Rate
What percentage of leads became paying clients?Number 3: Average Transaction Value
What’s the average amount a client pays?Number 4: Client Retention
How many months does an average client stay?Number 5: Delivery Capacity
How many clients can you serve excellently this month?
Everything else—traffic, followers, engagement, email opens—either feeds into these five or doesn’t matter.
Why these five matter
Direct control: They’re the only numbers you can directly change through action.
Revenue drivers: Each one mathematically drives revenue, not just impressions or attention.
The revenue equation
Revenue = Lead flow × conversion rate × average transaction value × (retention impact on LTV), constrained by delivery capacity.
Change any of the five, and revenue changes predictably.
Change anything else, maybe revenue moves, maybe it doesn’t.
Let’s see how this works in practice.
Move 1: How To Calculate The Five Numbers From Your Last 90 Days Of Revenue Data
Before you can improve the Five Numbers Framework, you need to know what those five numbers actually are right now.
Most founders guess their numbers, and those guesses are wrong about 70% of the time.
Calculate each number for the last 90 days:
Lead Flow — count every person who took a qualification step:
Booked a call
Filled an application
Requested a proposal
Joined a waitlist
Not website visitors. Not email subscribers. Qualified leads only.
How to calculate the next four numbers
Conversion Rate
Paying clients ÷ Qualified leads × 100Average Transaction Value
Total revenue ÷ Number of transactions (or new clients)Client Retention
Average months a client stays (for ongoing services) or repurchase rate (for one-time offers)Delivery Capacity
The maximum clients you can serve excellently without a quality drop
A coaching founder at $112K/month calculated her five:
Lead Flow: 87 leads over 90 days (from discovery calls + application fills)
Conversion Rate: 24 clients ÷ 87 leads = 27.6%
Average Transaction Value: $336K revenue (90 days) ÷ 24 clients = $14,000 per client
Client Retention: Average client stays 11 months
Delivery Capacity: Can serve 32 active clients excellently (currently at 29)
Now she had her baseline: five numbers that gave her a complete picture of the revenue engine.
Before this, she tracked 19 metrics and couldn’t identify why growth slowed; after this, she knew exactly where leverage lived.
The pattern is simple: most founders at $100K know their revenue number but don’t know the five inputs that create it, and you can’t optimize what you can’t measure.
Calculate your first five—using actual numbers, not estimates.
[Baseline Snapshot Example]

- Leads:          87
- Conversion:     27.6%
- Transaction:    $14,000
- Retention:      11 months
- Capacity:       32 clients (29 used)

---

=> One-page view
of the whole engine
With that baseline in place, the real work is deciding which of those five becomes your constraint and where the next $20K–$40K/month actually lives.
Move 2: How To Find Your Single Revenue Constraint Using The Five Numbers Framework
Once you know the five numbers, one of them becomes your constraint—the bottleneck that limits next‑level revenue.
The constraint isn’t the worst-looking number; it’s the one with the biggest gap between where it is now and where it could realistically be.
Use this framework:
Lead Flow constraint: You’re converting well, pricing well, retaining well, but not enough leads enter the system.
Conversion constraint: Plenty of leads, but too few become clients.
Transaction Value constraint: High lead flow, good conversion, but pricing is below market or offer structure caps revenue.
Retention constraint: Clients come in but don’t stay long enough or don’t buy again.
Capacity constraint: All other numbers are strong, but you physically can’t serve more clients without a quality drop.
Case: Agency owner at $94K/month
Lead Flow: 142 leads (90 days) — Strong
Conversion Rate: 38% — Strong
Average Transaction Value: $5,200 per project — Below market (competitors at $7,500–$9,000)
Client Retention: 68% repurchase within 12 months — Strong
Delivery Capacity: Can serve 15 concurrent projects (currently at 11) — Room to grow
Constraint: Transaction Value. If he raised prices to $7,500 (still below top competitors), revenue would jump from $94K to $135K monthly without changing anything else, using the same leads and conversion.
The math: 54 clients yearly × $7,500 (new price) ≈ $405K yearly in new contracts
The mix of existing clients on old and new pricing pulls the actual revenue total higher than the simple projection.
He raised prices in two weeks.
Three months later: $94K → $121K monthly (not quite $135K because some clients were on the old pricing, but still a 29% increase).
Here’s the edge case most founders ask: “What if I have two constraints?”
You probably don’t—one number is usually the obvious bottleneck.
If two numbers are genuinely tied, fix the one with faster implementation time first.
Conversion rate fixes (better sales process) usually happen faster
Lead flow fixes (building a new channel) take longer
Find your constraint. That’s where your next $20K–$40K monthly lives.
[Constraint Example]

Current price:    $5,200
Target price:     $7,500

54 clients yearly x $2,300 uplift = $124,200 more yearly

Same leads, same conversion
Once the bottleneck is named, you stop treating all five numbers as equal and design a 90-day push that defends the others while you move one.
Move 3: How To Set A 90-Day Target On One Five-Numbers Revenue Constraint
Once you know your constraint, set one specific target for 90 days—one number, not five. Most founders try to improve all five simultaneously and end up with diffused effort and minimal results.
The focus rule: improve your constraint by 15–35% in 90 days while maintaining the other four.
If Lead Flow is constrained:
Target: Increase from X leads/month to about 1.2X leads/month (roughly a 20% increase)
How: Add one new lead source or double down on the best existing channel
If Conversion is constrained:
Target: Increase from X% to X+8–12% (e.g., 28% → 36%)
How: Fix sales process, improve qualification, strengthen positioning
If Transaction Value is constrained:
Target: Increase from $X to $1.25X (25% increase)
How: Repricing, offer restructuring, or value-add bundling
If Retention is constrained:
Target: Increase average stay from X months to X+2 months or repurchase from X% to X+15%
How: Fix delivery experience, add continuation offers, implement retention system
If Capacity is constrained:
Target: Increase from X clients to 1.3X clients without quality drop
How: Delegation, systems, or team expansion (covered in The Delegation Map, The Quality Transfer, The 30-Hour-Week)
A course creator at $108K/month set her target:
Constraint: Conversion Rate (currently 22%, market average 32%)
90-Day Target: Increase to 30% (8-point improvement)
How: Rebuild sales page, add case study video, implement urgency mechanism
Implementation took 6 weeks (within protected fence time from The Time Fence). New conversion rate: 31%.
Revenue math:
Before: 89 leads × 22% ≈ 20 clients × $5,500 ≈ $108K/month
After: 89 leads × 31% ≈ 28 clients × $5,500 ≈ $152K/month
Revenue moved from about $108K to about $149K monthly in 90 days.
Same lead flow. Same offer. Better conversion.
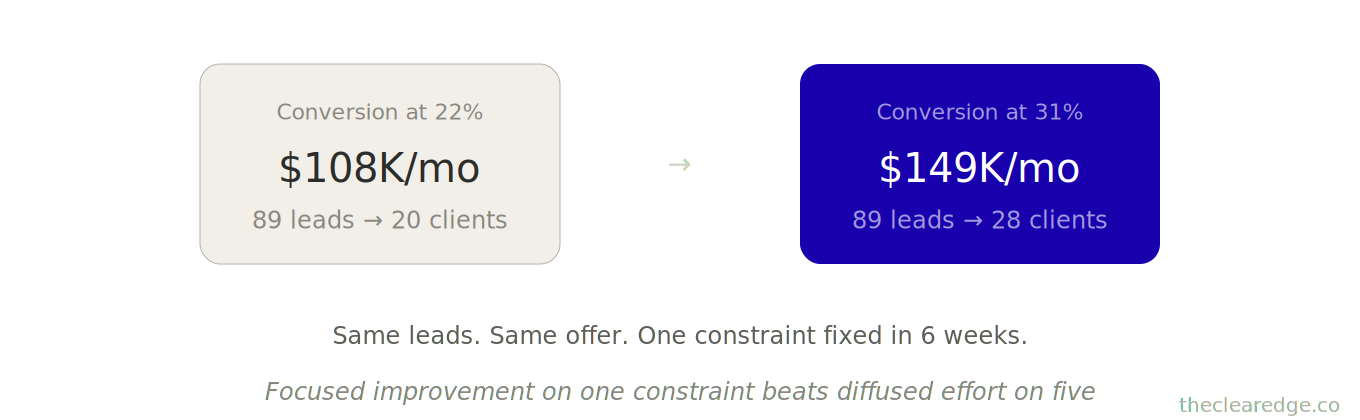
The pattern: focused improvement on one constraint beats diffused effort on five metrics. Always.
[90-Day Focus Rule]

Step 1: Pick 1 constraint

Step 2: Set 15–35% target

Step 3: Design ONE project

Step 4: Protect 6 weeks build

Step 5: Review at 90 days
How Client Retention Becomes The Highest Leverage Five-Number Metric Around $100K Months
Here’s what most founders at $100K miss: retention is the only number that compounds over time.
Linear vs compounding
Lead flow is linear. You get X leads this month, you get X leads next month (roughly).
Conversion is linear. You close Y% this month, you close Y% next month (roughly).
Retention compounds. Each extra month a client stays adds another month of revenue, so every past client acquisition becomes more valuable.
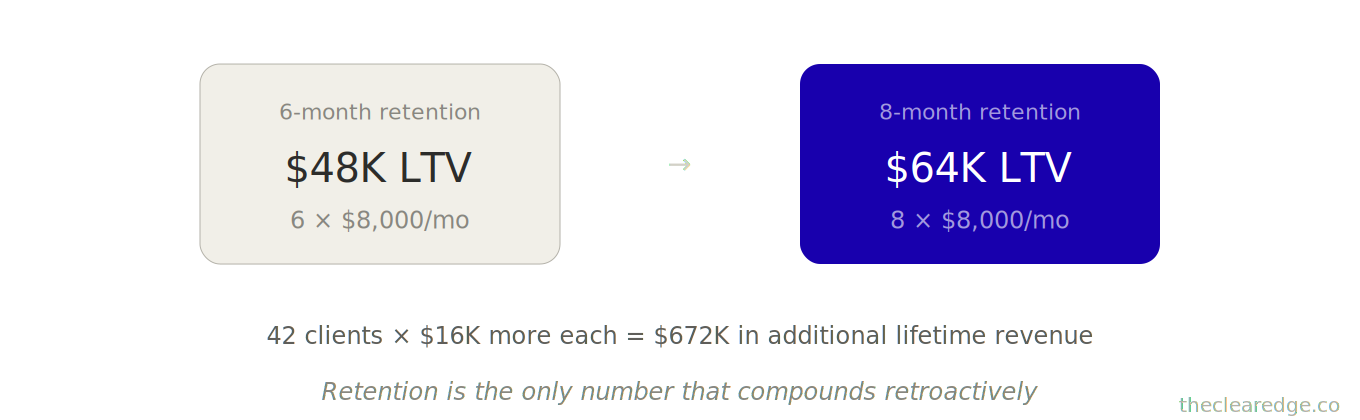
Retention impact example
Current: Average client stays 6 months at $8,000 monthly
Lifetime value: 6 × $8,000 = $48,000 per client
She improved retention from 6 months to 8 months (33% increase):
New lifetime value: 8 × $8,000 = $64,000 per client
Impact: Every client she ever acquired became worth $16,000 more. Retroactive value creation.
With 42 clients yearly, that’s 42 × $16,000 = $672,000 in additional lifetime revenue from the same lead flow and conversion rate.
What to do with low retention
Retention improvements take 3–6 months to show up in revenue because you’re extending how long current clients stay, not adding brand-new ones.
Once those extra months start stacking, the impact keeps compounding and doesn’t stop paying.
If your retention is below 8 months for services or below 50% repurchase for one-time offers, fix that before optimizing anything else—it’s the one number that makes every other effort work harder.
Once you understand how retention compounds, it becomes clear why most dashboards keep you staring at derivatives instead of the handful of drivers that actually change lifetime value.
What Changes When You Run A Five-Number Dashboard And The Time Cost To Implement It
Here’s why tracking seventeen metrics fails: most of them are derivatives, not drivers.
Derivatives that don’t move revenue
Email open rate doesn’t matter if leads don’t convert.
Social followers don’t matter if they don’t become leads.
Website traffic doesn’t matter if visitors don’t qualify.
Pipeline value is just lead flow × average deal size × estimated close rate—three numbers you already have.
Profit margin still matters, but it’s just revenue minus costs—and you already know revenue.
Strip away derivatives and vanity metrics and you’re left with the five that actually move the business.
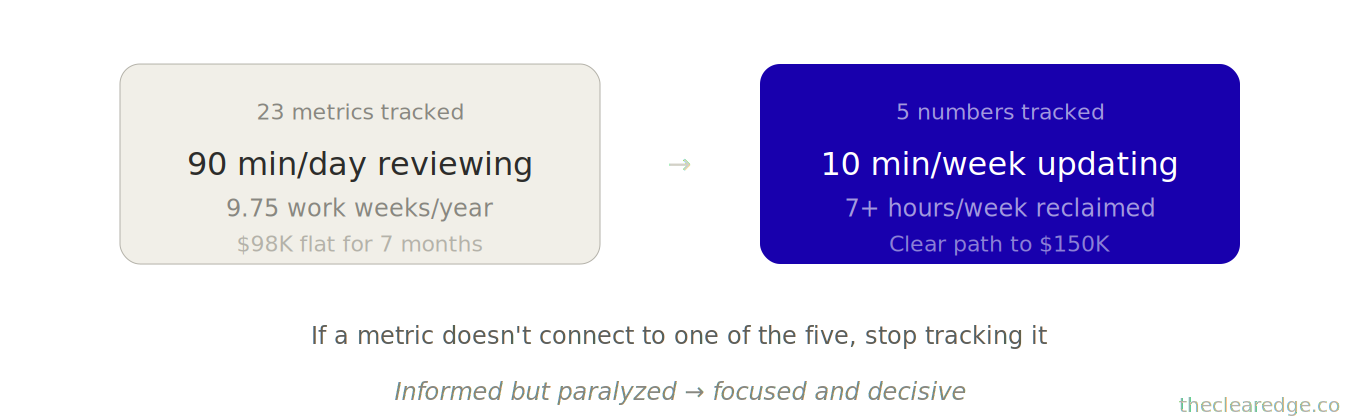
A consultant went from 22 tracked metrics to 5 and summed up the shift: “Before, I felt informed but paralyzed. Now I feel focused and clear. Revenue followed clarity.”
The rule is simple: if a metric doesn’t directly connect to one of the five numbers, stop tracking it—or delegate someone else to watch it while you focus on the five.
At $100,000 per month, your time is worth $250–$350 per hour.
Spending 90 minutes per day on irrelevant metrics costs $375–$525 per day.
Over a month, that’s $7,500–$10,500 in opportunity cost.
That’s enough to hire someone to manage the other metrics while you focus on leverage.
[Metric Filter]

Ask for each metric:

Does it change:

- Leads?
- Conversion?
- Transaction Value?
- Retention?
- Capacity?

If no

=> stop tracking it
(or delegate)
At that point, the only move that makes sense is simplifying your system to the five drivers and accepting what it costs to keep everything else out of your $250–$350/hour field of view.
What changes when you run a Five-Number dashboard and what it costs
Moving from dashboard overload to the Five Numbers Framework requires two concrete shifts:
Shift 1: Calculate Your Five
Pull 90 days of data.
Calculate:
Lead flow
Conversion
Transaction value
Retention
Capacity
Takes 2–3 hours one-time, 30 minutes monthly to update.
Shift 2: Build Simple Tracker
Create a one-page dashboard with only five numbers.
Update weekly or monthly (not daily).
Takes 45 minutes to build, 10 minutes monthly to maintain.
Total setup: 3–4 hours, one-time investment.
Weekly maintenance: 10 minutes (vs. 7.5 hours reviewing bloated dashboards).
Time saved: about 7 hours weekly—roughly 364 hours yearly, or more than 9 work weeks of redirected focus.
For a founder at $100K/month, that redirected focus typically unlocks an extra $20K–$50K/month within 90 days by targeting the actual constraint instead of optimizing noise.
One founder’s feedback after 60 days: “I thought tracking fewer metrics would make me less informed. Instead, it made me more decisive. Revenue moved because I finally knew which number to fix.”
When You Choose Seventeen Metrics Over Five
If you keep spending 9.75 work weeks a year staring at 17–23 metrics, you’re accepting stalled $100K–$115K months instead of running the Five Numbers Framework; cut the noise and commit to the five.
Run Your Five Numbers Scoring Gate Checklist
Next time you sit down with your revenue dashboard, run this before you touch any metric or project list.
☐ Calculated current 90-day Five Numbers from actual data and logged them on your one-page Five Numbers Framework tracker
☐ Scored which of the Five Numbers holds the biggest current-versus-possible gap and named that single constraint in writing
☐ Compared the constraint’s current value against the article’s example ranges and wrote your 90-day 15–35% target for that one number
☐ Logged the direct revenue impact using the article’s example math (e.g., $5,200 → $7,500, 22% → 31%, 6 → 8 months) for this constraint shift
☐ Marked a binary decision beside this constraint: “Keep current plan” or “Redesign next 90 days around this one constraint”
Every time you skip this, you’re choosing more 9.75-week dashboard loops and leaks like the $18K–$672K ranges baked into your current Five Numbers.
Where to Go From Here: Use The Five Numbers to Stabilize Six-Figure Months
At $95K–$115K/month, the risk is flying blind on the Five Numbers and donating tens of thousands in preventable shortfall.
From here, run the sequence once:
Map your Five Numbers to last quarter so you see exactly where the revenue leak starts and how much it costs you monthly.
Tie daily activity to each of the Five Numbers so every hour you work drives a visible lift in conversion, retention, or transaction value.
Set a First-Monday 30-minute Five Numbers review so you catch slippage early and keep $100K months repeatable instead of volatile.
Run this as a permanent operating layer and the Five Numbers protocol turns a fragile $100K into a floor instead of a peak.
Up Next: The 3% Lever For Compounding Small Improvements
Next article covers “The 3% Lever: Weekly Shifts That Compound Into $100K+ Over 12 Months for $75K–$95K Operators.” I will show you how small improvements in each of your five numbers create exponential results.
FAQ: Five Numbers Framework And Metrics For $95K–$115K Operators
Q: How does the Five Numbers Framework turn $95K–$115K months into $150K+ without more dashboards?
A: It replaces 15–25 metrics with five core numbers and frees 7.5 hours weekly from analysis loops. It then focuses moves like raising prices from $5,200 to $7,500 or lifting conversion from 22% to 31%, creating shifts such as $94K → $121K or $108K → $149K in 90 days.
Q: How do I calculate my five numbers for the last 90 days before changing anything?
A: Pull actual data to compute qualified Lead Flow, Conversion Rate, Average Transaction Value, Client Retention, and Delivery Capacity—using totals like 87 leads, 24 clients, $336K revenue, and 32 active-client capacity instead of guesses that are wrong 70% of the time.
Q: How do I use the Five Numbers Framework with its constraint step before setting new revenue goals?
A: After calculating the five, identify which has the biggest gap—for example Transaction Value stuck at $5,200 vs peers at $7,500–$9,000 or Conversion sliding from 42% to 31%—then make that single constraint the focus of your next 90 days rather than trying to improve all five at once.
Q: What happens if I keep tracking 17–23 metrics instead of just the five that drive $150K+?
A: You repeat patterns like a $98K/month educator spending 390 hours yearly and 9.75 work weeks in dashboards while revenue stays flat for seven months, or a $104K/month service business taking three weeks to notice conversion dropped from 42% to 31%, leaking $18K before acting.
Q: How much time and decision clarity do I gain by switching to a one-page five-number dashboard?
A: Setup takes 3–4 hours once and 10–30 minutes monthly to maintain, which frees over 364 hours per year compared to 90 minutes daily of metric reviews and gives you a single-page view where one constraint—like lead flow or retention—clearly tells you what to fix next.
Q: How do I know whether my constraint is lead flow, conversion, transaction value, retention, or capacity at around $100K/month?
A: Compare your current numbers against what’s possible—like 142 leads and 38% conversion being strong but $5,200 pricing lagging behind $7,500–$9,000 competitors, or an 11‑month retention and 32‑client capacity being solid while conversion at 22% clearly underperforms a 32% market average.
Q: How do I set a 90-day target using the Five Numbers Framework so my next $20K–$40K is realistic?
A: Choose a 15–35% improvement for your constraint, such as raising conversion from 22% to 30% or transaction value by 25%, then design one focused project—like rebuilding a sales page or repricing offers—that can be done in 6 weeks and measured over the next 90 days.
Q: What happens to revenue when I improve only conversion while keeping leads and pricing the same?
A: As shown with 89 leads monthly and price at $5,500, moving conversion from 22% to 31% lifted results from about 19.6 to 27.6 clients and shifted revenue from $107,800 to $151,800, turning a $108K → $149K monthly jump in 90 days without buying more traffic.
Q: How does improving client retention by a couple of months change my business compared to focusing only on new leads?
A: Extending average stay from 6 to 8 months at $8,000 monthly raises lifetime value from $48,000 to $64,000 per client, so with 42 clients yearly you add $672,000 in total LTV—value that compounds across past and future clients without increasing lead flow.
Q: What happens if I never simplify my metrics and keep operating from either gut feel or vanity dashboards?
A: You stay stuck in patterns where follower counts, engagement, and open rates look good but don’t translate into money, decisions drag for weeks, and opportunity costs pile up at $7,500–$10,500 per month in founder time that could have been used to move a single number that actually drives revenue.
Navigate The Clear Edge OS Systems for Scaling From $5K to $150K
Start here: The Complete Clear Edge OS — Your roadmap from $5K to $150K with a 60-second constraint diagnostic.
Use daily: The Clear Edge Daily OS — Daily checklists, actions, and habits for all 26 systems.
LAYER 1: SIGNAL (What to Optimize)
The Signal Grid • The Bottleneck Audit • The Five Numbers
LAYER 2: EXECUTION (How to Optimize)
The Momentum Formula • The One-Build System • The Revenue Multiplier • The Repeatable Sale • Delivery That Sells • The 3% Lever • The Offer Stack • The Next Ceiling
LAYER 3: CAPACITY (Who Optimizes)
The Delegation Map • The Quality Transfer • The 30-Hour Week • The Exit-Ready Business • The Designer Shift
LAYER 4: TIME (When to Optimize)
Focus That Pays • The Time Fence
LAYER 5: ENERGY (How to Sustain)
The Founder Fuel System • $100K Without Burnout
INTEGRATION & MASTERY
The Founder’s OS • The Quarterly Wealth Reset
AMPLIFICATION (AI & Automation)
The Automation Audit • The Automation Stack
⚑ Found a Mistake or Broken Flow?
Use this form to flag issues in articles (math, logic, clarity) or problems with the site (broken links, downloads, access). This helps me keep everything accurate and usable. Report a problem →
› More to Explore: Quick Navigation · The Clear Edge OS
➜ Help Another Founder, Earn a Free Month
If this system/article/framework just saved you from wasting 364+ hours and $18K–$672K in missed upside by tracking the wrong metrics, share it with one founder who needs that relief.
When you refer 2 people using your personal link, you’ll automatically get 1 free month of premium as a thank-you.
Get your personal referral link and see your progress here: Referrals
Get The Five Numbers Framework Toolkit For Implementation
You’ve read the system. Now implement it.
Premium gives you:
Ready-to-use PDF toolkit—every template, diagnostic, and formula pre-filled, zero setup, immediate use
Plug-and-play AI diagnosis sessions—drop into Claude, Gemini or ChatGPT, answer a few questions, save hours of guessing, get your exact next move
Audio key points—concentrated frameworks you can absorb in minutes, implement while you move
Unrestricted access to the complete library—every system, every update
What this prevents: Burning 9.75 work weeks and leaking $18K–$672K by drowning in 17–23 metrics instead of five.
What this costs: $12/month. Access the full Five Numbers Framework toolkit that matches this article’s system, ready to drop into your own dashboard.
Download everything today. Implement this week. Cancel anytime, keep the downloads.
Already upgraded? Scroll down to download the PDF, audio, and your AI session.
