
The Bottleneck Audit: Unblock Your Next $10K Month for $15K–$30K Operators
Most founders under $30K/month aren’t stuck from lack of effort—they’re blocked by one bottleneck in their revenue flow. The Clear Edge OS runs a Bottleneck Audit that exposes it fast.


The Executive Summary
Founders at $10K–$30K/month quietly leave $7K–$84K a year on the table by fixing the wrong problems; a simple Bottleneck Audit shows exactly where revenue leaks and how to plug them in.
Who this is for: Service founders, coaches, and course creators at $10K–$30K/month working 50–60 hour weeks who feel “always busy” yet stuck because each new fix barely nudges revenue.
The Bottleneck Problem: Misdiagnosing constraints burns $3,200–$7,000 on the wrong projects, 180+ hours of scattered effort, and blocks jumps like $13K → $22.1K or $7K → $15K that one correct fix could unlock.
What you’ll learn: A punchy Bottleneck Audit that maps your revenue flow, benchmarks each stage against real baselines, and uses simple math to expose the single constraint that moves revenue fastest.
What changes if you apply it: You stop guessing, fix show rate instead of traffic, close rate instead of branding, pricing instead of volume, and see jumps like $7K → $15K, $13K → $22.1K, or $15.2K → $34.2K in 60–90 days.
Time to implement: Spend 30 minutes today to map and measure your funnel, 2 focused hours this week to fix the biggest bottleneck, and 30 days tracking results before you move to the next constraint.
Written by Nour Boustani for $10K–$30K/month founders who want precise, compounding revenue gains without wasting six months and tens of thousands optimizing the wrong 4%.
Most $10K–$30K/month founders misdiagnose their bottleneck and leave $7K–$84K on the table. Upgrade to premium, apply the Clear Edge OS Bottleneck Audit, and run cleaner decisions around your next $10K month.
› Library Navigation: Quick Navigation · The Clear Edge OS
Why $10K–$30K Founder Revenue Stalls Even at 60-Hour Weeks
Most $10K–$30K founders I audit aren’t blocked by effort; they’re blocked by a misdiagnosed constraint.
In 87% of stalled businesses I review, the founder is actively fixing a problem that isn’t the true bottleneck—and here’s how that misdiagnosis shows up in real numbers.
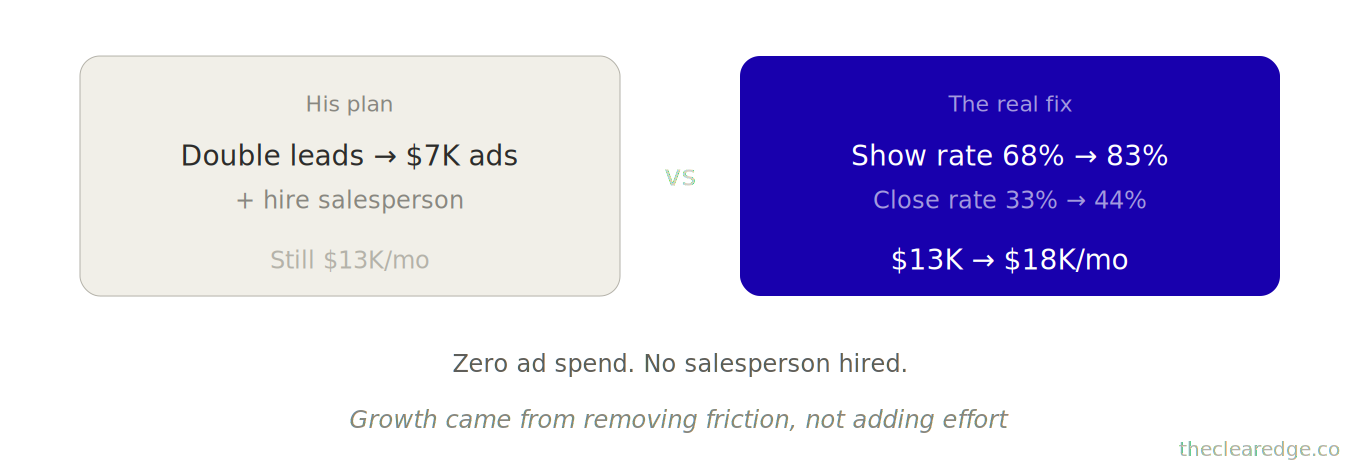
Last month, I talked to an agency owner making $13K/month who was convinced his problem was “not enough leads.” He wanted to hire a salesperson.
Budget: $3K monthly plus commission.
He’d also planned $4K in Facebook ads, a new platform launch, and LinkedIn content. Total planned spend: $7K monthly on lead generation.
I asked to see his numbers first:
Traffic: 800 monthly visitors
Lead capture: 18% opt in → 144 leads
Calls booked: 62% of those leads book a call → 89 booked calls
Show rate: 68% of booked calls actually happen → 60 actual calls
Close rate: 33% of calls become clients → 20 clients per month
Average sale: $650 per client
Monthly revenue: 20 clients × $650 = $13K monthly
“If I double leads to 288, I’ll get 40 calls monthly instead of 20 and close way more clients,” he said.
Wrong.
Lead volume is rarely the first constraint; it only feels that way because it’s the most visible number.
In his case, the real bottleneck was show rate: a 68% show rate meant 32% of booked calls never happened, which worked out to roughly 29 missed calls every month.
If we improved the show rate from 68% to 85%, here’s what happens step by step:
Start with the same booked calls: 89 booked calls.
Apply the new show rate: 89 × 85% = 76 actual calls (up from 60).
Keep the same close rate: 76 × 33% = 25 clients (up from 20).
That’s 5 additional clients per month.
At $650 per client, that’s 5 × $650 → $3,250 additional revenue per month.
But there was a bigger bottleneck hiding underneath.
His close rate: 33%.
Industry average: 45–55%.
If we fixed both the show rate and the close rate:
89 calls × 85% show = 76 monthly
76 × 45% close = 34 clients monthly
34 × $650 = $22,100 monthly
That’s nearly a 70% revenue increase from improved conversion alone.
We fixed three things in his booking process:
Added automated reminder sequence (email at booking, 24hrs before, 2hrs before)
Rewrote confirmation page (“We only take 3 new clients monthly”)
Added personal video message in confirmation email
Show rate: 68% → 83% in 30 days.
Then we rebuilt his discovery call script because the way he was running calls was blocking conversions.
He was pitching features instead of outcomes, talking for 35 minutes, listening for 10, and never asking directly for the sale.
New script:
First 15 minutes: diagnose (ask questions, listen)
Next 15 minutes: present a solution tied to their problem
Final 15 minutes: handle objections and ask for commitment
Close rate: 33% → 44% over 60 days.
Revenue: $13K → $18K monthly in 90 days. Zero ad spend. No salesperson hired.
Growth didn’t come from adding effort. It came from removing friction.
You’ve probably diagnosed your own business the same way.
Think you need more traffic? You probably need better conversion.
Think you need a new offer? Finish and sell the one you started.
Think you need a hire? Build a simple system first.
Every business has one main bottleneck. Fix that constraint and revenue moves; ignore it and nothing meaningful changes—that’s the math behind how $10K–$30K actually becomes $15K–$20K months.
Bottleneck Patterns at $5K–$50K Months and How They Actually Show Up in Revenue
Now that you’ve seen how one wrong fix stalls growth, here’s where that mistake usually hides at each level.
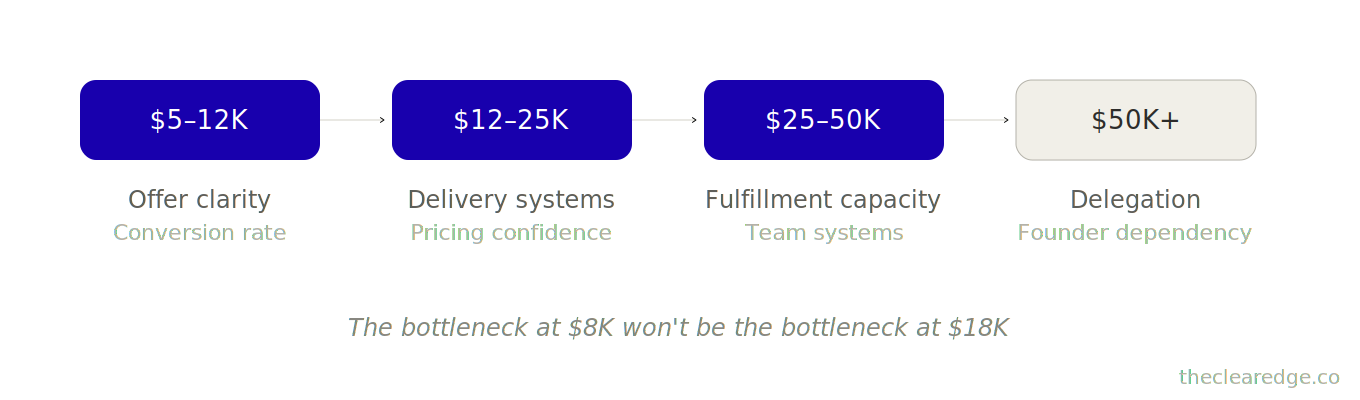
At every revenue stage, there’s a predictable pattern:
At $5–12K/month: Offer clarity or conversion rate
At $12–25K/month: Delivery systems or pricing confidence
At $25–50K/month: Fulfillment capacity or team systems
At $50K+/month: Delegation or founder dependency
The bottleneck you had at $8K won’t be the bottleneck at $18K. What got you here won’t get you there.
Coach at $7K/month: Misdiagnosed Traffic Problem
Coach making $7K/month
Surface numbers:
Traffic: 2,400 website visitors per month
Leads: 43 email sign-ups (1.8% conversion rate)
Her diagnosis: traffic bottleneck (“If I get 10,000 visitors, I’ll have 180 leads and make way more.”)
Diagnosis:
Real bottleneck: 1.8% email capture
Industry baseline: 3–5%
Good performers: 8–12%
Why capture was weak:
Opt-in buried at the bottom of blog posts
Offer: “Subscribe to my newsletter for updates.”
No value. No specificity.
We rebuilt it:
Moved the opt-in form to the top of every page.
Created a new offer: “Get My 3-Step Client Conversion Framework (the exact system I use with $50K/month coaches).”
Added an exit-intent pop-up to capture visitors before they leave.
Created content upgrades for the top 3 posts to boost sign-ups.
Email capture: 1.8% → 9.2% in 45 days.
2,400 visitors per month
2,400 × 9.2% = 221 leads per month (up from 43)
Her nurture sequence converts 8% of those leads to buyers.
221 × 8% = 18 sales per month
18 × $497 = $8,946 in monthly revenue
Revenue: $7K → $15K in 90 days by fixing the actual bottleneck.
You’ve probably spent months on the wrong fix, too.
Consultant at $11K/month: Close Rate, Not Leads
Another consultant was stuck at $11K/month for 8 months, working 55 hours a week with plenty of leads and lots of discovery calls—but only an 18% close rate.
“I need to get better at sales,” he said.
Maybe—but first, we looked at the system.
His process:
No pre-call questionnaire
First 20 minutes explaining his background
Next 15 minutes walking through three confusing service packages
Final 10 minutes with a weak close
We rebuilt it:
Pre-call form (5 questions)
First 5 minutes to build rapport
Following 20 minutes for diagnostic questions
Following 15 minutes to present ONE clear solution
Final 5 minutes for a direct ask
Close rate: 18% → 41% over 8 weeks.
He didn’t “get better at sales.” He fixed the process, the close rate doubled, and revenue followed.
Skill is overrated. Systems win.
Here’s the pattern I see constantly: founders work on surface symptoms while the real constraint sits untouched.
A course creator spends 15 hours a week making content, but her email list still isn’t growing because her content has no clear call to action.
An agency owner spends 4 hours rebuilding every proposal from scratch and makes leads wait 5 days, when what he actually needs is one proposal template with three simple variations.
A consultant working 62 hours a week to serve 7 clients at $1,800 each doesn’t need “more time”—she needs delivery systems that make her client work repeatable instead of custom every time.
REVENUE BAND → LIKELY BOTTLENECK
$5K–$12K/mo:
- Offer clarity
- Basic conversion
---
$12K–$25K/mo:
- Delivery systems
- Pricing confidence
---
$25K–$50K/mo:
- Fulfillment capacity
- Team systems
---
$50K+/mo:
- Delegation
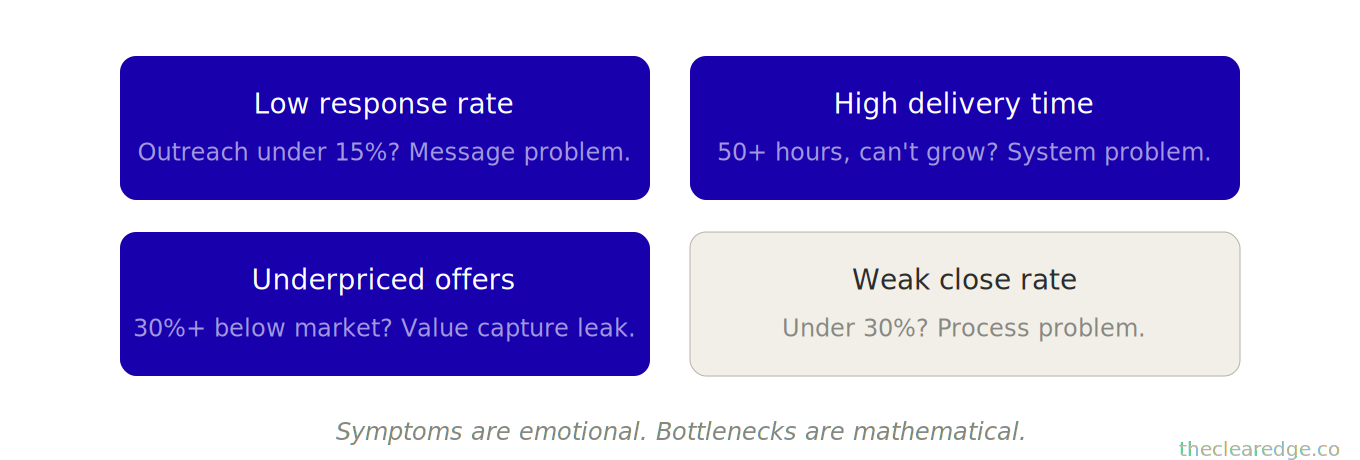
- Founder dependencyThe bottleneck is never what it feels like. Symptoms are emotional. Bottlenecks are mathematical.
Why $10K–$30K Founders Misdiagnose Bottlenecks and Optimize the Wrong Constraint
The broken parts of your business shout; the bottleneck quietly limits you.
A broken website crashes in your face. A bottlenecked sales process just converts worse than it should, and you never see the 40 people who almost bought but didn’t.
Underpriced Agency: Value Capture, Not Leads
One agency owner I worked with charged $1,800 per project, even though the market rate for his expertise was $4,500–$6,000. He didn’t see this as his bottleneck and believed he simply needed more clients.
Look at the math:
Current: 7 clients × $1,800 = $12,600 monthly.
If priced correctly: 7 clients × $4,500 = $31,500 monthly.
Difference: $18,900 monthly left on the table, $226,800 yearly.
Think about that!
We raised his price to $4,200.
Fears: “I’ll lose all my clients.”
Reality: He lost none—existing clients were grandfathered, and new clients came in at the higher rate.
Next 90 days: Closed four new clients at $4,200 = $16,800 (vs. $7,200 at old price).
Revenue: $12.6K → $21K monthly in 120 days.
The real bottleneck wasn’t lead volume; it was value capture—most pricing problems masquerade as marketing problems.
Scattered Effort: Six Projects, $500 Gain
Here’s another pattern: founders see multiple issues and try to fix them all simultaneously.
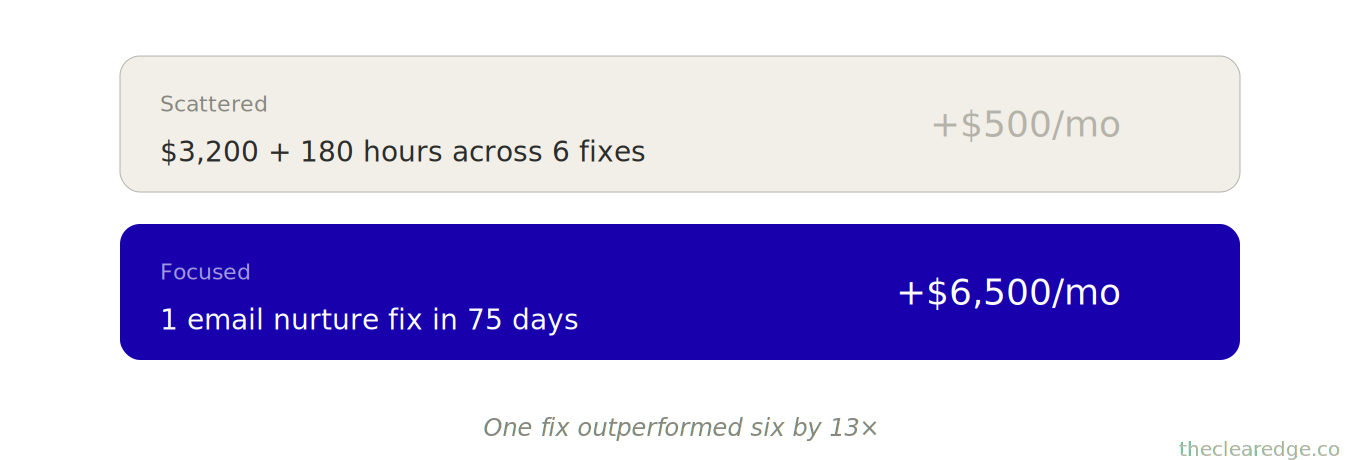
One coach tried this for over 90 days. She:
Rebuilt her website ($3,200)
Created a new lead magnet (40 hours)
Launched a podcast (60 hours)
Redesigned her group program (35 hours)
Started posting daily on LinkedIn (45 hours)
Total investment: $3,200 + 180 hours.
Revenue change: $9K → $9.5K (+$500 monthly).
Why so little movement? All that effort was spread across six different projects instead of fixing one real bottleneck.
We stopped everything and focused on one bottleneck: her email nurture sequence. She had 3,800 subscribers but only emailed when she launched (4 times a year), which meant 11 months of silence.
We built a weekly email system with soft CTAs.
Revenue: $9.5K → $16K in 75 days.
One fix. One bottleneck. Revenue moved.
Most founders don’t lack work ethic—they lack the ability to detect bottlenecks. You can’t fix what you can’t see, and you can’t see what you don’t measure. That’s why I built a system to diagnose this precisely.
How the Bottleneck Audit Toolkit Turns This Into a Quarterly Repeatable System
You now have the full Bottleneck Audit on paper: map, numbers, benchmarks, impact; the premium toolkit turns that into a repeatable system you can run every quarter without rebuilding.
You’ve seen how bad labeling skews $10K–$30K results; now you get the 90-minute Bottleneck Audit that shows exactly what to fix first.
Bottleneck Audit Diagnostic: How to Find Your Real Revenue Constraint in Under 90 Minutes
Here’s how to find your actual constraint in under 90 minutes.
Step 1: Map Your Complete Revenue Flow From Traffic to Delivery
Write every stage from stranger to paying client. Don’t skip steps.
Example: Revenue flows by model
General services: Traffic → Capture → Nurture → Call/Demo → Close → Deliver
Courses: Traffic → Capture → Email Sequence → Sales Page → Purchase → Fulfillment
Agencies: Outreach → Response → Discovery Call → Proposal → Close → Onboarding → Delivery
Be specific. Your flow might have 4 stages or 10 stages. Map what actually happens.
Step 2: Add Real Revenue and Conversion Numbers From the Last 60 Days
For each stage, write down how many people actually made it through. If you don’t have exact data, estimate conservatively using your CRM, email platform, calendar, invoices—wherever the numbers live.
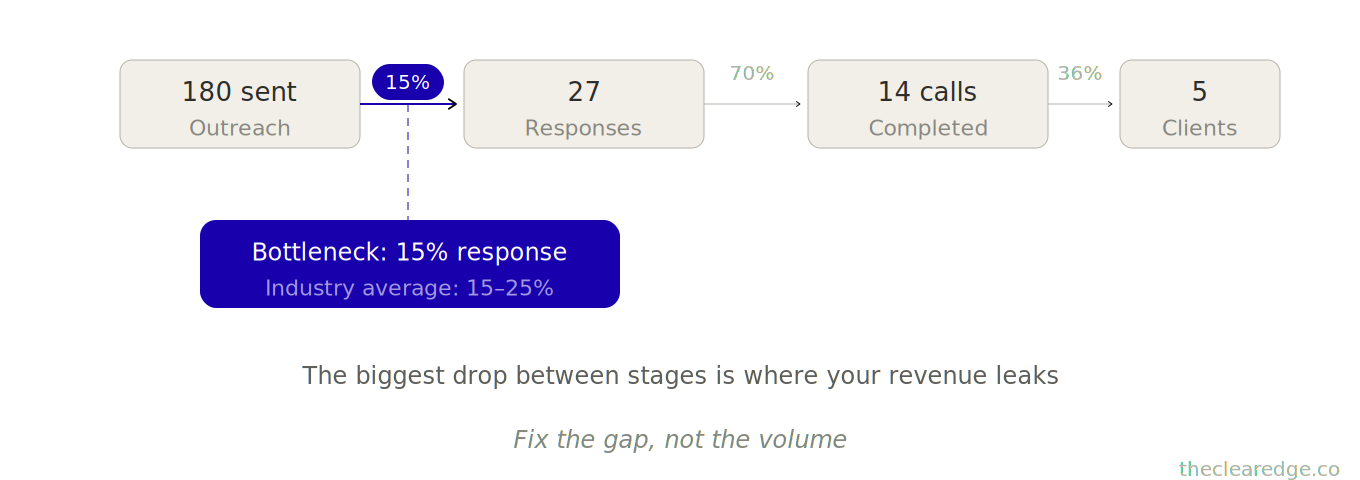
Example (consultant):
Outreach: 180 messages sent
Response: 27 responses (15%)
Calls Booked: 19 calls (70% of responses)
Calls Completed: 14 calls (74% show rate)
Closed: 5 clients (36% close rate)
Revenue: 5 clients × $2,400 = $12,000 monthly
Step 3: Calculate Conversion Rates at Every Stage of Your Revenue Flow
This is where the real bottleneck shows up—calculate what percentage of people move from one stage to the next.
Using the example above:
Response rate: 27 ÷ 180 = 15%
Booking rate: 19 ÷ 27 = 70%
Show rate: 14 ÷ 19 = 74%
Close rate: 5 ÷ 14 = 36%
Now you can finally see what’s happening. Most founders skip this step and then wonder why every decision still feels like a guess.
Step 4: Compare Each Conversion Rate to Proven Industry Benchmarks
This tells you if your number is a bottleneck or not.
Outreach response rate:
Below 10%: Weak messaging
10–20%: Average
20–30%: Strong
Above 30%: Excellent
Email capture rate:
Below 2%: Weak offer/placement
2–5%: Average
5–10%: Strong
Above 10%: Excellent
Show rate (booked calls):
Below 60%: Poor confirmation process
60–75%: Average
75–85%: Strong
Above 85%: Excellent
Close rate (service businesses):
Below 30%: Process or qualification issue
30–45%: Average
45–60%: Strong
Above 60%: Excellent (or under-priced)
Sales page conversion (courses/digital):
Below 2%: Weak messaging/offer
2–4%: Average
4–8%: Strong
Above 8%: Excellent
If your number is significantly below the benchmark, you have found a bottleneck.
Step 5: Calculate Revenue Impact of Improving Each Bottleneck by 30–50%
This is the most important step. It tells you which bottleneck to fix first.
Run the math: if you improve this conversion rate by 30–50%, what happens to revenue?
Example: A consultant with 14 completed calls per month and a 36% close rate signs 5 clients.
If the close rate improves to 50%:
14 × 50% = 7 clients (was 5)
That’s 2 additional clients monthly
If priced at $2,400:
2 × $2,400 = $4,800 additional revenue per month.
$4,800 × 12 = $57,600 additional revenue per year.
Run this calculation for every stage. The one that creates the biggest revenue lift becomes your priority bottleneck.
Step 6: Fix the Single Bottleneck With the Highest Revenue Upside First
Don’t fix three things. Fix one—the one with the highest revenue impact.
For the consultant above with a 36% close rate, here’s what we’d fix:
Add pre-call diagnostic form (qualifies interest before the call).
Rebuild discovery call structure (diagnose first, pitch second).
Add a clear, close question at the end (“Based on what we discussed, does it make sense to move forward?”).
Step 7: Measure Results for 30 Days, Then Move Sequentially to the Next Bottleneck
Set a measurement date 30 days from now. Check your new conversion rate, calculate the revenue impact, then move on to the next bottleneck.
Sequential fixes compound; simultaneous fixes dilute.
This is the exact process I use with every founder because it removes guessing—you see the numbers, fix the constraint, and revenue moves.
The Four Hidden Revenue Bottlenecks Quietly Capping $10K–$30K Founders
1. Low Response Rate on Outreach and Cold Traffic
Marketing consultant at $15.2K/month.
Surface numbers:
Sent 220 cold outreach messages monthly
Got an 11% response rate (24 responses)
Assumed the bottleneck was volume: “If I send 500 messages, I’ll get way more responses.”
Diagnosis:
Real bottleneck: 11% response rate
Industry average: 15–25%
We rewrote her outreach message:
Old: “Hi [Name], I help marketing agencies scale with proven systems. Would you be open to a quick call?”
New: “Hi [Name], I noticed your agency focuses on [specific niche]. I worked with three agencies in [niche] who grew 40–60% in 90 days by fixing one email sequence issue. Worth a 15-minute conversation?”
What changed:
Response rate on her outreach: 11% → 28% in 45 days.
With 220 messages, that’s 62 responses monthly (was 24).
Her close rate stayed at 32%.
So 62 × 32% ≈ 20 clients monthly at $1,800 average → $36K monthly.
Revenue: $15.2K → $34.2K in 90 days from the same 220 messages.
Same effort. Different message. Revenue doubled.
How to spot it: If you’re sending outreach (email, LinkedIn, DMs) and getting under 15% response, you have a messaging bottleneck.
How to fix it: Make it about them, not you, reference something specific to their business, and lead with a result, not a process.
2. Click-Through Rate (Email to Offer)
A course creator with 4,200 subscribers launched her course four times per year, sending 6 emails over 10 days for each launch.
Open rate: 38% (strong).
Click-through rate: 2.1% (terrible).
Sales page conversion: 6.8% (excellent).
She thought her bottleneck was email list size:
“If I had 10,000 subscribers, I’d make way more sales.”
Wrong.
Her real bottleneck was 2.1% click-through. Industry baseline — 4–8%.
Look at the math
Current:
4,200 subscribers × 38% open = 1,596 opens
1,596 × 2.1% click = 34 clicks
34 × 6.8% convert = 2 sales at $997 → $1,994 per launch.
If we fixed click-through to 6%:
1,596 × 6% = 96 clicks
96 × 6.8% = 7 sales → $6,979 per launch.
That’s $5K additional revenue per launch from fixing one number.
We changed three things:
Simplified CTAs (one clear link per email instead of three)
Added curiosity-driven subject lines tied to pain (”The mistake costing you $4K monthly”)
Created visual hierarchy (bold the link, add whitespace)
Results:
Click-through: 2.1% → 5.8% in one launch cycle.
Revenue per launch: $1,994 → $6,240.
Same list. Same sales page. Different email structure.
How to spot it: If email open rate is above 30% but click-through is under 4%, you have a CTA/curiosity bottleneck.
How to fix it: Use one link per email, make that link impossible to miss, and write curiosity-driven language that makes people want to click.
3. High Delivery Time Per Client Limiting Capacity
Consultant making $10,800/month from 6 clients at $1,800 each, working 62 hours weekly.
Every client got a custom delivery.
Zero templates. Zero systems.
Her assumption—thought her bottleneck was pricing:
“If I charge $3,000 per client, I’ll make $18K monthly.”
Diagnosis:
Real bottleneck was delivery time — she couldn’t take on more clients because she was maxed out on hours.
Current time math:
Time per client was 25 hours per month, including onboarding, strategy, check-ins, reporting, and support.
With 6 clients, that meant 6 × 25 hours = 150 hours of delivery every month.
Spread over roughly 4 working weeks, that’s about 37–38 hours per week on delivery alone.
Once you add sales, admin, and content, her total workload lands around 60–62 hours per week.
She had zero capacity for growth. Raising the price alone wouldn’t fix it.
We systematized the repeatable parts:
Onboarding: Recorded welcome video + automated sequence.
Time: 90 min → 30 min.
Weekly check-ins: Changed to async Loom updates.
Time: 45 min → 10 min.
Monthly strategy: Kept live (high-value, custom).
Deliverables: Built template library.
Time: 8–12 hours → 3–5 hours.
Support: Set office hours (batched vs. reactive).
Time: 3–5 hours → 1.5 hours.
Reporting: Built dashboard template.
Time: 2 hours → 20 min.
New capacity and revenue math:
New time per client: ~7 hours monthly (was 25 hours)
She could handle 6 clients in 42 hours monthly instead of 150 hours
Freed up 108 hours monthly
Used it to take on 4 more clients at $1,800 → +$7,200 monthly
Revenue: $10,800 → $18,000 in 4 months.
Effective rate: $72/hour → $257/hour.
Systems leverage always beats personal effort.
How to spot it: If you’re working 50+ hours weekly and can’t take on more clients, you have a delivery efficiency bottleneck.
How to fix it: List every step in your client delivery, circle what repeats across clients, and build one template this week for the most time-consuming repeatable task.
Value Capture and Underpriced Offers at $10K–$30K Months
Profile: Designer made $8,400/month from 7 clients at $1,200 each. Market rate for her expertise and results: $3,500–$5,000 per client.
Her assumption:
Thought her bottleneck was getting more clients.
Diagnosis:
Her real bottleneck was leaving $16,100 monthly on the table.
Current vs market pricing math:
Current pricing: 7 clients × $1,200 = $8,400 monthly
Market-rate pricing: 7 clients × $3,500 = $24,500 monthly
Difference: $16,100 monthly = $193,200 yearly.
What we changed:
Raised her price to $3,200 for new clients
Existing clients were grandfathered at $1,200
4-month outcome:
Closed 5 new clients at $3,200 = $16,000 (vs. $6,000 at old price)
Kept 4 existing at $1,200 = $4,800
Revenue: $8,400 → $20,800 in 4 months. Same work. Different price.
How to spot it: Pricing 30%+ below market rate → value capture bottleneck.
How to fix it: Raise prices for new clients only. Grandfather existing clients. Test with one client at the new rate.
You’ve just seen how these four bottlenecks play out in real P&L math; next is what actually changes once you fix the right one.
What Changes in Revenue and Control When You Fix the Real Bottleneck
Here’s the pattern when founders identify and fix their actual constraint:
Revenue jumps faster than effort increases.
One agency went from $13K to $18.5K in 90 days by fixing two conversion bottlenecks. Zero additional marketing spend.
Confidence returns because you can see cause and effect.
One consultant said:
“I used to feel like revenue was random — one month $9K, the next month $14K, with no idea why. Now I know exactly which lever to pull.”
Control increases because you’re optimizing the right constraint.
One course creator said,
“I wasted 6 months A/B testing my sales page trying to get conversion from 4.2% to 6%. Then I fixed email click-through, and revenue doubled in 30 days.”
I’ve seen this framework move founders from:
$7K to $15K in 90 days (fixed email capture)
$13K to $18K in 90 days (fixed show rate and close rate)
$15.2K to $34.2K in 90 days (fixed outreach response)
$10,800 to $18K in 4 months (fixed delivery efficiency)
The pattern is always the same: Stop guessing. Map your full revenue flow, find the stage where most people drop off, and fix that first.
Once you see bottlenecks, you stop guessing—and revenue becomes predictable.
The Real Revenue Cost of Fixing the Wrong Bottleneck for 3–12 Months
Every month you optimize the wrong bottleneck costs you real revenue.
Case 1: Website redesign vs. email capture
One consultant spent $6,200 on a new website over 3 months while his real bottleneck was an 8% email capture rate.
Fixed email capture in 90 minutes and revenue tripled in 60 days.
Cost of wrong focus: 3 months + $6,200 + $21K in lost revenue.
Case 2: Sales page tweak vs. click-through
One coach spent 6 months improving her sales page. Conversion inched from 4.2% to 5.1%, and revenue went up by $600 per month.
Then we fixed the click-through rate in 2 weeks and revenue jumped by $2,600 per month.
Outcome: +$600/month from 6 months of sales page tweaks; +$2,600/month from 2 weeks of click-through improvements
Cost of wrong focus: 6 months for a $600 gain when a $2,600 gain was available in 2 weeks
Case 3: Hiring salesperson vs. fixing outreach
Another founder almost hired a $4,200/month salesperson to “fix” a 36% close rate.
Before signing the contract, we mapped his funnel and saw his real bottleneck was a 14% outreach response rate — even if he doubled the close rate, he’d only add two clients monthly because he wasn’t getting enough conversations.
Outcome: response rate went to 31%, and he closed 4 additional clients without the hire
Cost avoided: $4,200/month in salary he didn’t need to spend
Net swing: $19,400/month in revenue impact, or $232,800/year, from diagnosing correctly instead of guessing
Here’s the math on bottleneck mistakes:
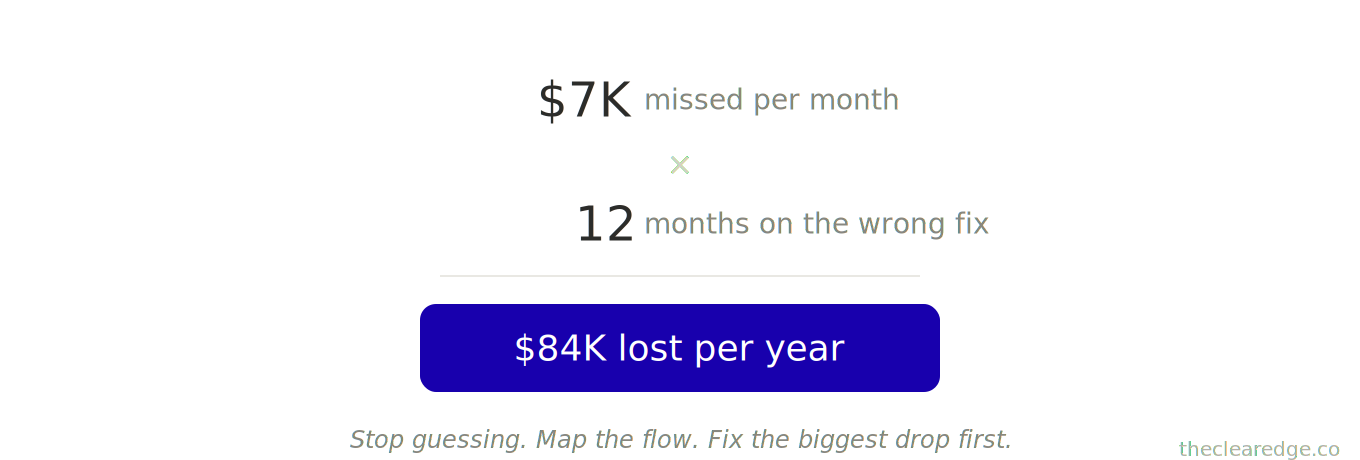
If you’re stuck at $12K/month and your real bottleneck would take two weeks to fix, it would move you to $19K/month.
Every month you work on the wrong thing costs you $7K.
Three months → $21K lost.
Six months → $42K lost.
One year → $84K lost.
That’s real money you didn’t make because you were optimizing the wrong constraint. This is the work that moves revenue.
Run the Bottleneck Audit Field Test Checklist
Next time you’re between $15K and $30K and tempted to “fix everything,” run this before you change a single lever.
☐ Mapped your full revenue flow from Traffic → Capture → Nurture → Call → Close → Deliver using only the last 60 days of hard numbers.
☐ Calculated conversion at every stage and wrote which numbers sit below the article’s “strong” benchmarks for your model.
☐ Ran the 30–50% improvement math for each weak stage and circled the single bottleneck with the biggest 30-day dollar upside.
☐ Picked one fix for that bottleneck, blocked a 2-hour implementation window this week, and wrote the one metric you’ll re-check in 30 days.
☐ Logged today’s revenue and chosen bottleneck so you can see if you’re repeating the $7K–$84K wrong-constraint leak pattern.
Every time you skip this, another $7K–$84K in upside burns on the wrong constraint while your next $10K month stays blocked.
The Price Of Fixing The Wrong Constraint
Every month you push on the wrong bottleneck quietly burns $7K–$84K that never comes back; run the Bottleneck Audit and move that effort where it actually pays.
Your Move: Run the 90-Minute Bottleneck Audit Before Tomorrow
Before you dive back into your to-do list, do this:
Today (30 minutes):
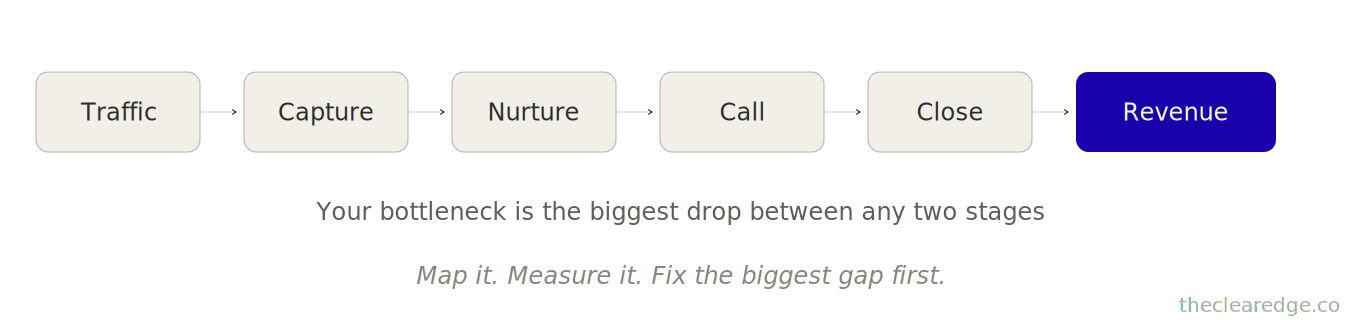
Map your complete revenue flow from stranger to paying client. Write every stage: Traffic → Capture → Nurture → Call → Close → Deliver.
Add real numbers to each stage based on the last 60 days. If you don’t have the data, start tracking today.
Calculate the conversion rate at each step. What percentage makes it from one stage to the next?
This Week (2 hours):
Identify your biggest drop. Where do most people fall off? That’s likely your bottleneck.
Calculate the potential impact of fixing it. Run the math — if you improve this rate by 50%, what happens to revenue?
Make one fix, not three fixes. One. The biggest bottleneck only.
Set a measurement date: “I’ll check results on [date 30 days from now].”
Next 30 Days:
Track the change. Did conversion improve? By how much?
Calculate revenue impact. How much additional revenue did this generate?
Move to the next bottleneck. Repeat the process. Fix sequentially, not simultaneously.
The founders who do this in the next 48 hours will be ahead of the founders who read this and do nothing.
Which one are you?
Name Your Biggest Drop-Off Point
What’s the one part of your revenue flow where most people drop off?
Drop your answer below. I read every reply, and the patterns that show up often shape what I write next.
And if you don’t know your numbers yet, just say “I need to map this” — that awareness alone puts you ahead of most founders.
Up Next: Three Moves That Turn Bottleneck Fixes Into a $50K/Month Business
In “The Three Moves to $50K: Direction, Protection, and Multiplication for $30K–$40K Operators”, I’ll break down the three moves that turn bottleneck fixes into sustainable growth systems that get you to $50K/month.
If you’ve been stuck at $15-30K, wondering what actually unlocks the next level, you won’t want to miss it.
FAQ: Using the Bottleneck Audit Revenue System to Unlock Your Next $10K Month
Q: How does the Bottleneck Audit help unlock my next $10K–$20K per month in under 90 minutes?
A: It maps your entire revenue flow, benchmarks each stage against real baselines, and uses simple math to reveal the single constraint where a 30–50% improvement can create jumps like $7K → $15K, $13K → $22.1K, or $15.2K → $34.2K within 60–90 days.
Q: How do I run a Bottleneck Audit step by step before deciding what to fix next?
A: First, map every stage from Traffic → Capture → Nurture → Call → Close → Deliver, then add 60 days of real numbers and conversion rates at each step, compare them to benchmarks, and choose the one weak link where fixing it has the biggest revenue upside over the next 30 days.
Q: What happens if I keep fixing the wrong bottleneck instead of my real constraint?
A: You burn $3,200–$7,000 projects and 180+ hours on surface fixes that move revenue by only $500/month, while the correct bottleneck could have added $5,000–$7,000+ monthly and $7K–$84K yearly that you never get back.
Q: How do I know if my real bottleneck is traffic, capture, nurture, calls, or delivery?
A: After you calculate conversion at each stage, you compare them to baselines like 2–5% vs 9–12% email capture, 60–75% vs 83–85% show rates, 30–45% vs 44–60% close rates, and 2–4% vs 6–8% sales page conversion, then prioritize the stage where your number is farthest below “strong” and where a 30–50% lift produces the largest dollar gain.
Q: How do I use the Bottleneck Audit with its revenue flow mapping before I spend on ads, hires, or redesigns?
A: Map your full flow, run the numbers, and calculate the revenue impact of improving each stage by 30–50%, then only invest in ads, a salesperson, or a new website if those changes actually move the bottleneck math more than simple fixes like show-rate reminders, nurture emails, or pricing adjustments.
Q: When is my show rate the real bottleneck instead of lead volume or ad spend?
A: If you’re already booking calls but only 60–70% show up—like 89 calls booked with 60 completed at a 68% show rate—raising that to 83–85% can add 5–14 extra clients and jumps such as $13K → $18K or $22.1K monthly without buying more traffic.
Q: How much can fixing close rate alone move my revenue without changing traffic or offers?
A: In cases like going from 33% to 44% close rate or from 18% to 41%, the same 14–76 calls per month turn into 2–14 extra clients, creating increases such as $13K → $18K, $11K → $21K, or $12K → $18K within 60–120 days using only script and process changes.
Q: How do hidden bottlenecks like delivery time and pricing quietly cap my monthly income?
A: When each client takes 25 hours monthly or is priced at $1,200 instead of $3,200–$4,500, you lock yourself into 50–62 hour weeks and ceilings like $8.4K–$10.8K, while systemizing delivery and raising prices for new clients can free 100+ hours, push effective rates from $72/hour to $257/hour, and move you to $18K–$20.8K monthly in a few months.
Q: What happens if I keep diluting effort across six projects instead of fixing one bottleneck?
A: You repeat patterns like spending $3,200 plus 180 hours on websites, podcasts, and new lead magnets for a $500 monthly gain, instead of focusing two hours on a single bottleneck such as email nurture that can take you from $9.5K → $16K in 75 days.
Q: How much time should I budget to find and fix my true bottleneck using this audit?
A: Plan 30 minutes today to map your revenue flow and add numbers, two focused hours this week to fix the biggest constraint, and 30 days of tracking to confirm changes before moving to the next bottleneck so gains like $7K → $15K, $13K → $22.1K, or $15.2K → $34.2K can compound instead of stall.
Navigate The Clear Edge OS Systems for Scaling From $5K to $150K
Start here: The Complete Clear Edge OS — Your roadmap from $5K to $150K with a 60-second constraint diagnostic.
Use daily: The Clear Edge Daily OS — Daily checklists, actions, and habits for all 26 systems.
LAYER 1: SIGNAL (What to Optimize)
The Signal Grid • The Bottleneck Audit • The Five Numbers
LAYER 2: EXECUTION (How to Optimize)
The Momentum Formula • The One-Build System • The Revenue Multiplier • The Repeatable Sale • Delivery That Sells • The 3% Lever • The Offer Stack • The Next Ceiling
LAYER 3: CAPACITY (Who Optimizes)
The Delegation Map • The Quality Transfer • The 30-Hour Week • The Exit-Ready Business • The Designer Shift
LAYER 4: TIME (When to Optimize)
Focus That Pays • The Time Fence
LAYER 5: ENERGY (How to Sustain)
The Founder Fuel System • $100K Without Burnout
INTEGRATION & MASTERY
The Founder’s OS • The Quarterly Wealth Reset
AMPLIFICATION (AI & Automation)
The Automation Audit • The Automation Stack
⚑ Found a Mistake or Broken Flow?
Use this form to flag issues in articles (math, logic, clarity) or problems with the site (broken links, downloads, access). This helps me keep everything accurate and usable. Report a problem →
› More to Explore: Quick Navigation · The Clear Edge OS
➜ Help Another Founder, Earn a Free Month
If this system just saved you from losing $7K–$84K this year by optimizing the wrong bottleneck, share it with one founder who needs that relief.
When you refer 2 people using your personal link, you’ll automatically get 1 free month of premium as a thank-you.
Get your personal referral link and see your progress here: Referrals
Get the Bottleneck Audit Toolkit to Unlock Your Next $10K Month
You’ve read the system. Now implement it.
Premium gives you:
Ready-to-use PDF toolkit—every template, diagnostic, and formula pre-filled, zero setup, immediate use
Plug-and-play AI diagnosis sessions—drop into Claude, Gemini or ChatGPT, answer a few questions, save hours of guessing, get your exact next move
Audio key points—concentrated frameworks you can absorb in minutes, implement while you move
Unrestricted access to the complete library—every system, every update
What this prevents: Wasting six months and $84K in lost upside by fixing the wrong 4% instead of the real bottleneck.
What this costs: $12/month. Everything you need to run the Bottleneck Audit is already in this toolkit.
Download everything today. Implement this week. Cancel anytime, keep the downloads.
Already upgraded? Scroll down to download the PDF, audio, and your AI session.
