
The Automation Stack: Build Your $150K Business Infrastructure in 30 Days for $125K–$150K Operators
A five-layer Automation Stack inside The Clear Edge OS that wires Seed, Pipeline, Delivery, Intelligence, and Maintenance into one observable workflow graph you can route and upgrade in 30 days.


The Executive Summary
Founders between $85K and $145K/month burn thousands and 20–30 hours monthly on disconnected tools; a five-layer Automation Stack built in 30 days unlocks $150K-ready infrastructure and real saved hours instead of pretend ones.
Who this is for: $85K–$145K/month operators and founders (like Rachel at $124K/month) already spending $500–$1,240/month on tools, working 50–51 hours weekly, and still acting as the human glue between nine disconnected apps.
The Automation Stack Problem: You’re buying features instead of workflows, ending up with 6–10 tools, 3–4 data silos, and 18–33 hours monthly lost to manual bridges, firefighting, and broken handoffs that quietly cap you below $150K.
What you’ll learn: The five-layer Automation Stack—Seed, Pipeline, /Delivery, Intelligence, and Maintenance—with concrete builds (Jordan’s memos, Vanessa’s pipeline, Nina’s onboarding, Owen’s dashboard, Quinn’s maintenance) that keep the stack running at 94% uptime.
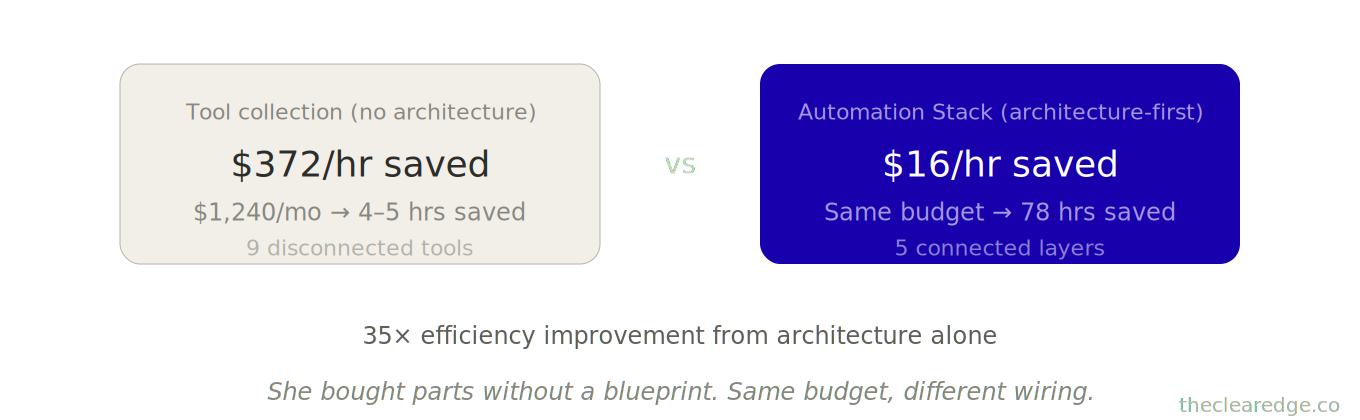
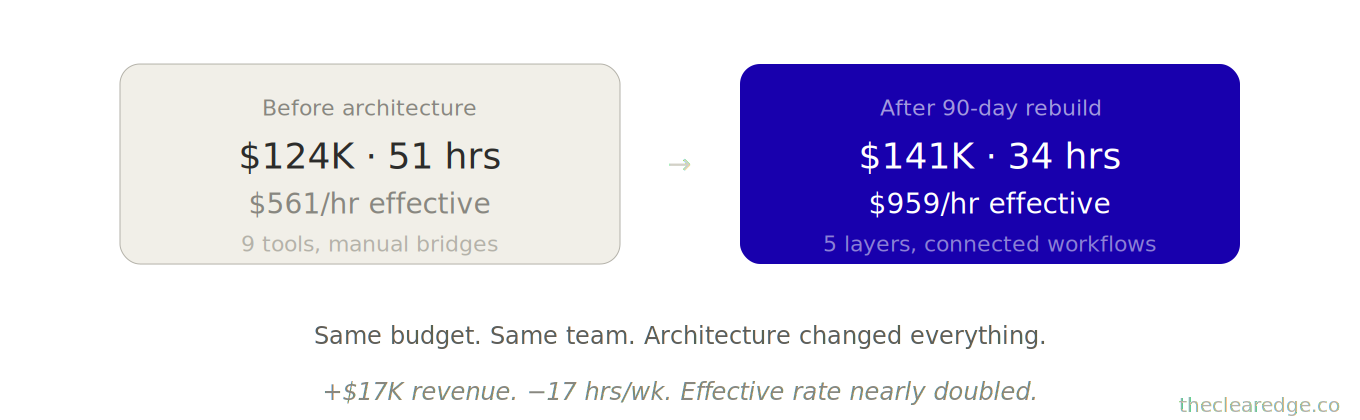
What changes if you apply it: You move from paying $372 per hour saved on scattered tools to about $16 per hour saved with architecture-first design, see shifts like $124K → $141K in 90 days or $119K → $148K in 8 months, and trade 51-hour weeks for 34-hour weeks while client satisfaction climbs from 7.8 → 9.1/10.
Time to implement: You can stand up all five layers in 30 days, spend 6–12 hours per build cycle, and then run a 30‑minute monthly + 90‑minute quarterly maintenance rhythm that prevents 10–15 hours of firefighting and compounds into 78–143 hours monthly saved across the full stack.
Written by Nour Boustani for $85K–$145K/month founders and operators who want $150K-ready automation infrastructure without becoming tool collectors, working 50+ hours weekly, or watching brittle workflows quietly tax every project.
At $85K–$145K/month, the real cost isn’t tools—it’s paying $372 per hour saved on scattered automation. Upgrade to premium and rebuild around the Automation Stack.
› Library Navigation: Quick Navigation · The Clear Edge OS
Why Buying Automation Tools Doesn’t Save Founder Time At $85K–$145K
Rachel sat at $124K/month, spending $1,240/month on tools and still working 51 hours weekly (221 hours monthly).
Make, Zapier, Claude Pro, Notion AI, Jasper, Typeform, Airtable, video automation, and email sequences hummed in the background.
Her stack looked sharp. Her days looked identical to 6 months earlier.
The problem wasn’t capability—it was architecture. She bought parts without a system, like paying for lumber and windows without ever drawing a blueprint.
She ran nine disconnected tools doing isolated tasks:
Typeform handled onboarding.
Notion required manual project setup.
Proposals came from templates.
Follow-up sat in calendar reminders.
Her dashboard pulled from 3 places she updated by hand.
Her effective rate was $561/hour ($124K ÷ 221 hours). Tools saved maybe 4–5 hours monthly, for roughly $2,500 in value against $1,240 in cost.
On paper, the return on investment worked. In practice, she was paying for tool collection, not workflow design.
Then she rebuilt around workflows, not tools. Same budget. Different architecture.
90 days later:
Revenue shifted $124K → $141K.
Weekly hours fell 51 → 34 (147 hours monthly).
Effective rate climbed $561 → $959/hour.
At $85K–$145K/month, once you’ve seen the tool-collection failure pattern in Rachel’s numbers, the Automation Stack is the only lens that makes sense for what follows.
The Tool-Collection Failure Pattern Breaking Automation For $85K–$145K Operators
At every revenue stage, founders make the same mistake.
At $85K–$105K/month:
You buy tools based on features, not integration needs.
You end up with 6–10 tools that don’t connect.
You spend 8–12 hours monthly manually bridging gaps between those tools.
At $105K–$130K/month:
Your team uses different tools for similar tasks.
Marketing uses one CRM while sales uses another.
Data lives in 4 separate places across your stack.
You act as the human database, doing 10–15 hours of reconciliation every month.
At $130K+/month:
Tools work individually but break at handoff points between teams and workflows.
Lead capture works, but qualification remains a manual step.
Onboarding is automated, but project kickoff still requires founder intervention.
You spend 12–18 hours every month fixing integration failures.The bottleneck isn’t capability—it’s connection architecture.
Across 52 implementations I’ve built between $80K–$145K monthly revenue, the pattern is consistent—tool collection beats workflow design until someone forces architecture-first thinking.
[Automation Failure Pattern]

Buy Tools
   |
   v
Disconnected Apps
   |
   v
Manual Bridges
   |
   v
Hidden Time Cost
   |
   v
Revenue Ceiling < $150K
The Automation Stack only becomes real when you see how each layer behaves inside an $85K–$145K business that’s currently paying $372 per hour saved for scattered tools.
The Five-Layer Automation Stack For Building $150K-Ready Automation Infrastructure
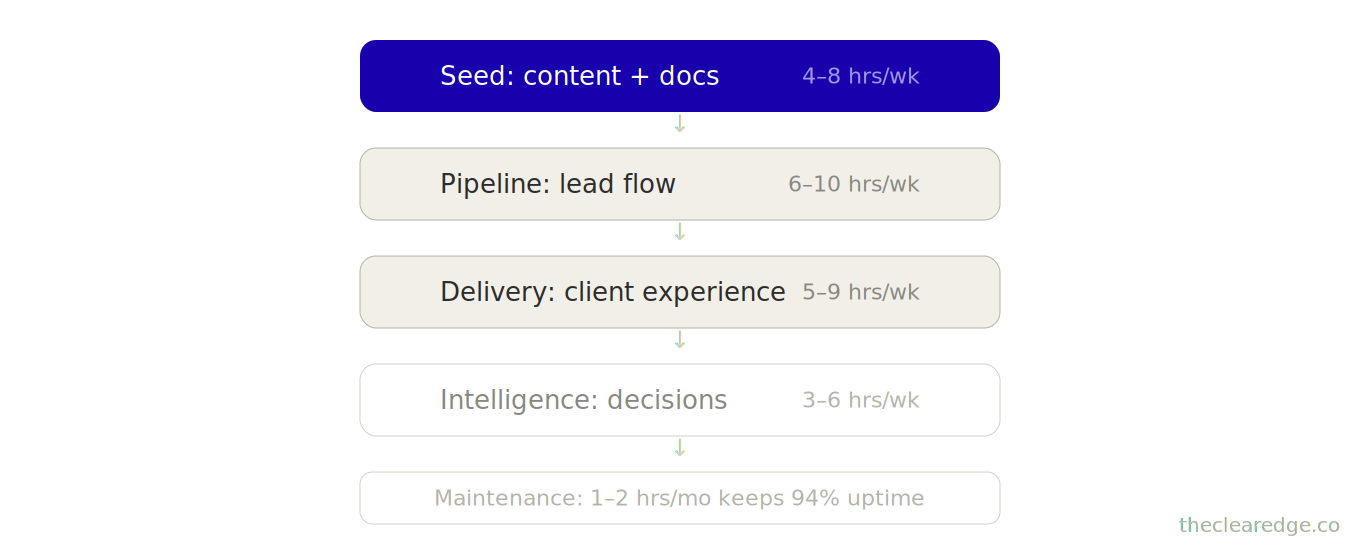
Think of automation as five connected layers, not isolated tools. Each layer feeds the next.
Layer 1: SEED (Content Generation)
Produces the raw material—emails, proposals, copy, analysis.
Time impact: 4–8 hours weekly when built right.
Layer 2: PIPELINE (Lead Flow)
Captures, qualifies, nurtures, and converts inquiries into booked conversations.
Time impact: 6–10 hours weekly.
Layer 3: DELIVERY (Client Experience)
Onboards, coordinates, collects feedback, triggers next steps.
Time impact: 5–9 hours weekly.
Tools: Airtable, automated sequences, project management integration
Layer 4: INTELLIGENCE (Decision Support)
Tracks metrics, identifies patterns, generates insights, flags issues.
Time impact: 3–6 hours weekly.
Tools: Dashboard automation, AI analysis, reporting systems
Layer 5: MAINTENANCE (System Health)
Monitors automation performance, catches breaks, and updates prompts.
Time impact: 1–2 hours monthly (prevents 10–15 hours of firefighting).
Tools: Health check templates, alert systems
Total time saved: 18–33 hours weekly (78–143 hours monthly) when all five layers connect.
Most founders build Layer 1 only (content prompts), maybe Layer 2 (email automation), then wonder why the impact is minimal.
The value compounds when layers integrate.
Let me show you how each layer works with real infrastructure.
When Tools Become a Tax
You’ve seen how $372 per hour saved happens when the stack runs on ad hoc zaps. Upgrade to premium to install the Automation Stack and enforce connection architecture.
Layer 1: Seed Automation For Content And Document Work In $85K–$145K Businesses
This isn’t “use ChatGPT for emails.” This is prompt architecture for business-critical outputs.
Seed Layer Case: Jordan’s Memo System
Jordan ran a $108K/month productized consulting firm.
Real bottleneck: Writing custom strategy memos for clients post-engagement.
Per-memo load: Each memo: 90–120 minutes of analysis + writing.
Volume: 12 memos monthly → 18–24 hours.
He built a memo generation system with three components.
Component 1: Client research prompt
Pulls website copy, LinkedIn profile, and competitor analysis.
Uses that information to position the client in their market context.
Output: a 200–300 word situational summary generated in about 8 minutes.
Component 2: Strategic analysis prompt
Takes the situational summary plus Jordan’s engagement notes.
Generates 3–5 strategic recommendations and explains the reasoning behind each.
Output: a 400–500 word strategic analysis generated in about 12 minutes.
Component 3: Memo assembly prompt
Combines the research summary and strategic analysis into one document.
Formats everything in Jordan’s voice (conversational, direct, data-driven) and adds relevant case study references.
Output: a 1,200 word client memo generated in about 15 minutes.
Results:
Before: 2 hours per memo
After: 35 minutes (mostly review + refinement)
17 hours saved per month.
17 × 12 = 204 hours saved per year.
204 × $200/hour = $40,800 in yearly value.
But here’s what made it consultant-proof: Jordan trained each prompt on 15 of his best memos.
The output matched his authority positioning—specific, data-backed, operationally precise. Clients couldn’t tell which memos were AI-assisted.
The Seed Layer Structure
Email Response Library (8 scenarios)
Initial inquiry response (qualification questions embedded)
Proposal follow-up (addresses common objections)
Project status update (progress + next steps + blockers)
Scope change discussion (manages expectations)
Referral request (triggered post-success)
Contract renewal (value recap + next phase)
Difficult conversation (pricing, timeline, scope creep)
Thank you + testimonial request (relationship maintenance)
Strategic Document Templates (5 types)
Proposals (problem-solution-case study-pricing)
Onboarding guides (expectations-process-timeline-tools)
Project briefs (context-objectives-approach-deliverables)
Quarterly reviews (metrics-wins-issues-next quarter)
Case studies (challenge-solution-results-testimonial)
Analysis Prompts (4 categories)
Client research (market position, competitors, challenges)
Performance analysis (metrics interpretation + pattern identification)
Decision support (options evaluation + recommendation)
Content generation (social posts, newsletters, thought leadership)
Seed Layer Case: Samira’s Prep System
Samira’s $97K/month coaching business used the Seed Layer for client prep.
Before automation: 45 minutes per call reviewing notes and building a discussion guide.
After automation: She spends 12 minutes per call reviewing an AI-generated prep document that summarizes past themes, current challenges, and suggested discussion topics.
Time saved: 33 minutes per call × 32 calls monthly = 17.6 hours monthly.
The key: voice consistency
Prompts included tone instructions (“use contractions, ask questions, reference past conversations”).
Banned phrases (“dive deep,” “unpack,” “circle back”).
Output format (bullets, not paragraphs).
How to build the seed automation layer first:
Pick your three most frequent writing tasks (emails, proposals, reports).
Pull 5–8 best examples of each (your highest-quality outputs).
Build prompts that extract patterns, structure, and voice from those examples.
Test on three real situations, refine based on what needs manual editing.
Time investment: 6–8 hours.
Monthly return: 12–20 hours saved.
### Example Seed Layer Prompt: Samira’s Client Prep System

You are Samira, a leadership and executive coach.
You are preparing for an upcoming 60-minute client session.

Your job: Generate a concise prep document for this call.

Follow these style rules:
- Use contractions.
- Ask 2–3 direct questions the coach can use live.
- Reference past conversations where relevant.
- Use bullets instead of long paragraphs.
- Avoid the phrases “dive deep,” “unpack,” and “circle back.”

---

You’ll receive:
- Past session notes
- Client background
- Current goals or challenges
- Any agenda notes for the upcoming call

---

Structure your output like this:

1. Past Themes (3–5 bullets)
   - Summarize what has mattered most in recent sessions.

2. Current Challenges (3–5 bullets)
   - List concrete issues the client is facing right now.

3. Opportunities / Levers (3–5 bullets)
   - Highlight specific areas where a shift this week would create progress.

4. Questions to Explore (3–5 bullets)
   - Write direct coaching questions Samira can ask on this call.

5. Next-Step Hypotheses (2–3 bullets)
   - Suggest likely actions the client might commit to if the call goes well.

Using the provided context, generate the prep document in this exact structure and voice.
Those Seed wins matter, but the Automation Stack only compounds when that same architecture starts catching leaks in Pipeline instead of adding more fragmented tools.
Layer 2: Pipeline Automation To Turn Lead Flow Into Booked Revenue
Pipeline layer case: Vanessa’s lead flow stack
This is where revenue leaks become captured revenue.
Vanessa ran a $116K/month brand design studio.
Starting point: Strong inbound (80–100 inquiries monthly), weak conversion (9% to booked calls).
Real gap: Manual qualification— inquiries sat 24–72 hours before response; by then, 40% had moved on.
She built a pipeline automation stack.
Step 1: Intelligent capture
Contact form submission
Triggers instant qualification questions (project type, budget range, timeline, decision maker).
Routes all responses into Airtable.
Step 2: Automated triage
High-fit leads (budget + timeline match)
Receive an instant calendar link.
Get a welcome video introducing the studio and process.
Mid-fit leads
Enter a nurture sequence with case studies and a process overview.
Receive a calendar link on day 3.
Low-fit leads
Are sent to a resource library.
Are added to a quarterly check-in sequence.
Step 3: Pre-call preparation
When a call is booked
It triggers a client research prompt (Layer 1 integration).
The AI-generated summary is sent to Vanessa 1 hour before the call.
Step 4: Post-call sequence
After the call completes
An automated follow-up goes out (thanks, proposal timeline, next steps).
Then: proposal delivery → 3-day check-in → 7-day close sequence.
Results:
Before
9% inquiry-to-call conversion.
3-day average response time.
After
17% inquiry-to-call conversion.
6-minute average response time (automated).
Revenue impact:
80 monthly inquiries × 8% conversion lift = 6.4 additional calls.
At 35% close rate ≈ 2.2 extra clients per month.
2.2 × $8,500 = $18,700 extra revenue per month.
$18,700 × 12 = $224,000 extra revenue per year.
Build cost and payback:
Setup cost: $2,080
$280 for the Make pro plan
9 hours building workflows at roughly $200/hour ≈ $1,800 in time
$280 + $1,800 ≈ $2,080 total setup cos
Payback: 11 days.
Pipeline Automation Architecture for High-Intent Lead Capture and Follow-Up
Capture → Qualify → Route
Form submission triggers the qualification workflow.
Responses scored automatically (budget match, timeline fit, decision authority).
High scorers: instant response + calendar link.
Lower scorers: enter nurture sequence.
Nurture → Warm → Convert
Day 1: Welcome email + case study matching their industry.
Day 3: Process overview video + calendar link.
Day 7: Social proof (testimonials from similar clients).
Day 14: Direct ask (“ready to discuss? book here”).
Day 30: Resource send + quarterly check-in automation.
Follow-Up → Close → Onboard
Meeting booked: confirmation + prep questions.
Call completed: thank you + proposal timeline.
Proposal sent: 3-day check-in (questions?).
Proposal accepted: instant onboarding sequence trigger (Layer 3 connection).
Pipeline Layer Case: Xavier’s Demo Follow-Up System
Xavier’s $133K/month SaaS consulting practice automated his demo follow-up.
Before: 24–48 hours to send recap + proposal.
After: 15 minutes post-demo (automated recap pulls from his meeting notes, generates customized proposal, sends with calendar link for next conversation).
Result:
Close rate: 22% → 34% (speed + personalization both improved).
Time saved: 14 hours monthly on follow-up coordination.
Edge Case: Hybrid Automation For High-Touch Leads
Constraint: What if your leads need a human touch immediately?
Build hybrid automation.
Garrett’s $95K/month executive coaching business can’t fully automate—relationships matter.
His system:
Inquiry arrives.
Instant automated response (“Got your message, reviewing now”).
Alert to Garrett’s phone.
He personally responds within 2 hours.
Automation handled acknowledgment (prevents “did they get it?” anxiety). Garrett handled relationship building (personal touch preserved)—best of both.
How to Implement the Pipeline Automation Layer Next
Map your current lead journey (inquiry → booked call → proposal → close).
Identify manual steps taking 2+ hours monthly.
Build one automation that removes the biggest time sink.
Test with 20 leads, measure conversion + time saved, refine.
Time investment: 8–12 hours.
Monthly return: 10–16 hours saved + conversion lift.
Once Pipeline stops leaking revenue, the Automation Stack shifts to Delivery, where the same architecture pulls hours back from founder-dependent onboarding and coordination.
Layer 3: Delivery Automation For Client Onboarding And Service Coordination
Delivery layer case: Nina’s onboarding system
This is where founder dependency starts to break—clients get a better experience while you regain meaningful time in your week.
Nina ran a $119K/month content strategy agency.
Every new client required a 5-hour onboarding process:
Kickoff call
Tool setup
Document collection
Team intro
Process walkthrough
Volume: 7 new clients monthly → 35 hours.
She built onboarding automation:
Contract signed → automated sequence begins
Day 1: Welcome email with video (Nina explaining process, team intro, what to expect).
Day 2: Document collection (automated form requesting brand assets, access credentials, style guides).
Day 3: Tool provisioning (automatic invites to Slack, project management, file storage).
Day 4: Strategy call booking (calendar link with pre-call questions).
Day 5: Pre-call prep document delivered (client research + initial recommendations from Layer 1).
By the time Nina had her strategy call (now 60 minutes, not 3 hours), the client had already:
Watched process overview.
Submitted all required materials.
Gained access to collaboration tools.
Received initial strategic recommendations.
Results:
Before: 5 hours per client onboarding.
After: 1.5 hours (strategy call + quick review).
Time saved:
24.5 × 12 = 294 hours per year.
294 × $200/hour = $58,800.
Experience shift:
Onboarding felt professional, organized, and high-touch (pre-recorded video felt more polished than rushed Zoom calls).
Client satisfaction scores: 7.8 → 9.1 out of 10.
Delivery Automation Architecture for Onboarding, Coordination, and Retention
Onboarding Automation
Contract trigger → welcome sequence.
Document collection (forms, not email back-and-forth).
Tool provisioning (automatic access, not manual invites).
Prep work delivered before the first strategic conversation.
Project Coordination
Milestone completion → status update to client (automated).
Deliverable ready → feedback request (scheduled, not manual reminder).
Revision submitted → approval workflow (tracks changes automatically).
Project complete → feedback form + testimonial request.
Maintenance Touchpoints
Monthly check-ins (automated prompt: “How’s everything? Any issues?”).
Quarterly reviews (performance data auto-generated, sent as PDF).
Anniversary emails (relationship maintenance, renewal discussions).
Referral requests (triggered after positive feedback).
Delivery layer case: Cole’s status update system
Cole’s $101K/month web development shop automated project status updates.
Before:
Clients asked “where are we?”
Cole checked with the team.
He wrote a status update email.
He sent it manually.
This happened 12–15 times weekly and took 6–8 hours.
After:
Project management system tracks project milestones.
It generates a daily summary.
It sends updates to clients automatically when milestones are completed.
Clients stay informed, Cole never touches it.
Time saved: 7 hours weekly ≈ 30 hours monthly.
Failure mode: Over-automation that removes human connection.
Leah automated every touchpoint, including thank-you messages after projects.
The experience started to feel robotic to clients.
Client retention dropped from 68% to 52%.
After:
She rebuilt the system to automate coordination only.
Scheduling, reminders, and document flow ran automatically.
Relationship moments stayed human (kickoffs, reviews, celebrations, thank-yous).
Client retention recovered to 71%.
The rule: automate logistics, personalize relationships.
How to Implement the Delivery Automation Layer in Your Client Journey
Map your client journey (signed → onboarded → delivered → closed).
Identify repetitive coordination tasks, such as:
document collection
status updates
feedback requests
Automate 2–3 highest-volume touchpoints.
Preserve strategic and relationship moments as founder-led.
Time investment: 10–15 hours.
Monthly return: 15–25 hours saved.
With Delivery stabilized, the next constraint in an $85K–$145K business is decision speed, which is where the Intelligence layer turns scattered data into fast, defensible calls.
Layer 4: Intelligence Automation For Data-Driven Decisions And Alerts
This layer makes you smarter faster.
Intelligence layer case: Owen’s weekly data ritual
Owen ran a $137K/month digital marketing consultancy.
Manual routine — 2.5 hours every Monday.
Pulling data from 6 platforms (Google Ads, Facebook, LinkedIn, Analytics, CRM, billing).
Building his dashboard, analyzing trends, writing a weekly summary.
He automated the entire intelligence layer:
Component 1: Data aggregation
All platforms send data via automated pulls.
All data lands in a central Airtable master database that runs nightly.
Component 2: Dashboard population
Airtable runs automated formulas to calculate the Five Numbers:
Lead flow
Conversion rate
Average transaction value
Retention
capacity utilization
The visual dashboard updates automatically.
Component 3: Insight generation
An AI analysis prompt (Layer 1 integration) reviews week-over-week changes.
It identifies three key patterns:
what’s up
what’s down
what’s concerning
It generates a 200-word strategic summary.
Component 4: Alert triggers
If any metric drops more than 10% week-over-week, the system:
sends an instant Slack alert
includes context so you know what changed and where to look
Owen’s Monday ritual: 25 minutes reviewing the pre-generated dashboard and insights instead of 2.5 hours building them.
Time saved:
2 hours weekly × 4.33 weeks ≈ 8.7 hours monthly
2 hours weekly × 52 weeks = 104 hours yearly
But the strategic value exceeded time savings.
In week 3 post-launch, conversion rate dropped 14%, and an automated alert flagged the issue first thing Monday morning.
Owen investigated the same day, found a technical problem on the landing page, and fixed it within 6 hours.
Under the old system, he would have noticed the drop 2–3 weeks later when manually building the dashboard, putting an estimated $22K–$31K in revenue at risk.
Intelligence Automation Architecture for Metrics, Patterns, and Alert Systems
Automated Metrics Tracking
All data sources → central database (nightly sync)
Key metrics calculated automatically (no manual formulas)
Visual dashboard updates without founder input
Pattern Recognition
AI analysis reviews trends (week/month/quarter comparisons)
Identifies deviations (what changed, magnitude, potential causes)
Generates plain-language summary (what happened + why it matters)
Alert Systems
Threshold-based triggers (>10% drops, conversion failures, capacity warnings)
Context included (not just “leads down 15%”—includes comparison periods, potential factors)
Delivered where you work (Slack, email, dashboard notification)
Insight Distribution
Weekly summary (automated, ready Monday morning)
Monthly deep dive (trend analysis + strategic recommendations)
Quarterly reset prep (data collection for The Quarterly Wealth Reset)
Piper’s $114K/month course business automated her student success tracking.
Previously:
She updated spreadsheets manually. Spent 4 hours monthly reviewing:
completion rates
satisfaction scores
support tickets
Now:
Platform data flows into Airtable. AI analysis generates a summary covering:
completion trends
common friction points
satisfaction drivers
The summary is delivered as a PDF.
Results:
Time saved: 4 hours monthly.
Strategic gain: she caught a completion rate drop in week 2 of a new course launch (technical issue in module 3) and fixed it immediately.
Refund rate improved from 8% to 2% for that cohort.
Do this next:
List your Five Numbers (or core business metrics you track manually)
Connect data sources to a central database (Airtable, Google Sheets, or specialized dashboard tool)
Build automated calculations (formulas that run without you)
Set up 1-2 alert triggers for critical thresholds
Time investment: 8-12 hours.
Monthly return: 6-10 hours saved + faster pattern detection.
Those Intelligence gains only hold if the stack doesn’t quietly decay, which is why the Maintenance layer turns your automations into a managed asset instead of a brittle experiment.
Layer 5: Maintenance Automation To Keep Systems Healthy And Reliable
This is the layer everyone skips—then wonders why their automations break.
Quinn built beautiful automation: pipeline workflows, onboarding sequences, and dashboard tracking.
Months 1-3: Worked perfectly.
Month 4: Small breaks started.
Month 6: Half his automations weren’t running.
The problem was simple: he had no maintenance protocol. Tools updated, integrations changed, prompts drifted, and there was no system to catch degradation early.
So he rebuilt the stack with a dedicated maintenance layer.
Monthly Health Check (30 minutes):
Review automation run logs (which workflows executed, which failed)
Test 3 random automations end-to-end (trigger → completion)
Check data sync accuracy (is the dashboard showing current data?)
Review AI output quality (are prompts still generating good results?)
Quarterly Optimization (90 minutes):
Update prompts with new learnings (voice drift correction, improved instructions)
Consolidate redundant automations (built three that do similar things and merge them into one).
Review tool costs vs. usage (paying for things you don’t use anymore?)
Test integration health (API connections still working?)
Annual Stack Audit (3 hours):
Full workflow review (which automations still serve the current business?)
Tool replacement analysis (better options available now?)
ROI recalculation (what’s delivering vs. what’s dead weight?)
Rebuild priority list (what new automations would have biggest impact?)
Quinn’s results after implementing maintenance:
Caught 8 broken workflows before they caused client issues
Consolidated 12 automations into 5 (saved $180/month in tool costs)
Updated 23 prompts that had drifted (quality improved noticeably)
System reliability: 94% uptime vs. 67% without maintenance
Maintenance Automation Architecture For Health Monitoring And Drift Prevention
Health Monitoring
Weekly quick check (5 minutes reviewing logs for errors)
Monthly deep check (30 minutes testing critical paths)
Quarterly optimization (90 minutes updating + consolidating)
Quality Assurance
Prompt output review (are AI results maintaining quality?)
Client feedback on automated touchpoints (does it still feel good?)
Team input on workflow usability (is automation helping or hindering?)
Drift Prevention
Documentation of all automations (what it does, why it exists, how it works)
Change log (when we update, what we changed, why)
Version control for prompts (track iterations, can roll back if needed)
How to Implement the Maintenance Automation Layer Without Skipping It
Set a monthly 30-minute calendar block for a health check
Create a simple maintenance checklist (test these five automations, review these three metrics)
Document where each automation lives (which tool, which workflow, trigger conditions)
Build rollback plan (if automation breaks, how do you temporarily revert to manual?)
Time investment: 30 minutes monthly, 90 minutes quarterly
Value: prevents 10–15 hours of firefighting broken systems
[Maintenance Rhythm]

Weekly  -> Log Check

Monthly -> Health Check

Quarterly -> Optimization

Yearly -> Stack Audit
   |
   v
94% Uptime, Fewer Emergencies
Once Maintenance locks in 94% uptime, you can finally see the stack-wide effect of architecture-first design on revenue, hours, and cost-per-hour-saved across the Automation Stack.
What Changes In Revenue And Hours With A Full Stack
1. Revenue scales without hiring
Rachel went $124K → $141K (+14%) with the same 4-person team.
Her per-person revenue jumped $31K → $35.25K monthly.
2. Founder hours drop dramatically
Nina reclaimed about a third of her week while revenue grew, redirecting those hours into higher-leverage client work and business development.
52 Automation Stack Implementations: Outcome Range
I’ve tracked 52 stack implementations at $95K–$145K monthly revenue over 18 months:
$108K → $134K in 5 months (consultant, Layers 1 + 4).
$116K → $139K in 6 months (agency, Layers 2 + 3).
$119K → $148K in 8 months (service business, all five layers).
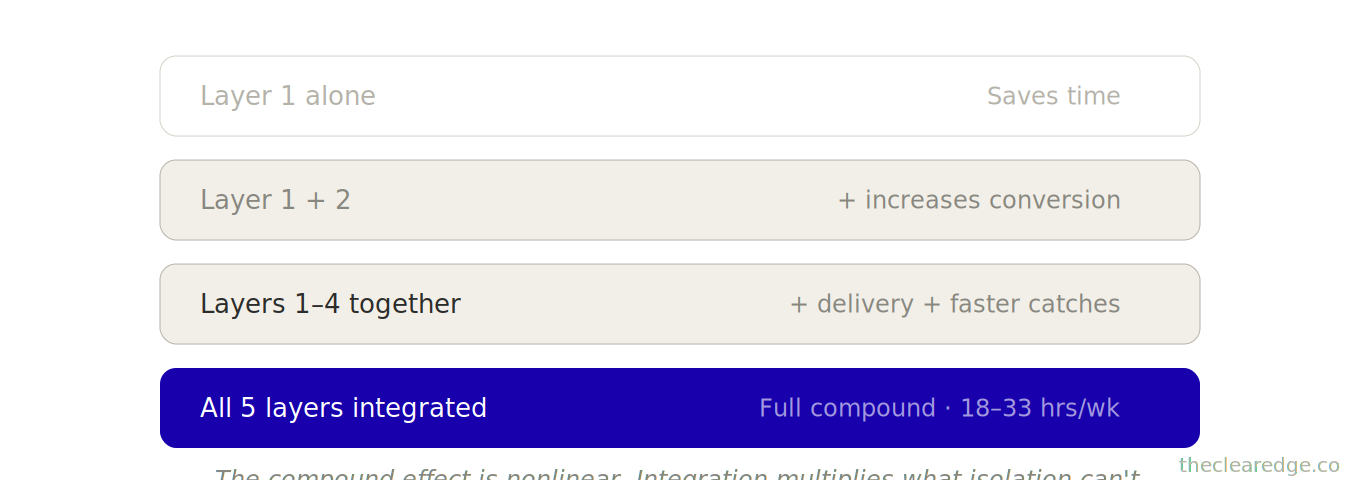
The Pattern: Layer Value vs. Integration Effect
Each layer saves 4–8 hours per week, but integration multiplies the impact.
Layer 1 alone: saves time.
Layer 1 + Layer 2: saves time and increases conversion.
Layers 1–4 together: save time, increase conversion, improve delivery, and catch issues faster.
The compound effect is nonlinear.
Those jumps across 52 implementations are what make the cost of building wrong so stark when you compare:
$372 per hour saved
$16 per hour saved
The Real Cost of Buying Automation Tools without Architecture
Here’s what I need you to understand: buying tools without architecture wastes money and time.
Pre-architecture spend and ROI:
Rachel spent $1,240/month for 6 months, totaling $7,440, on disconnected tools before rebuilding. Those tools saved maybe 20 hours total over 6 months.
Cost per hour saved: $372
Post-architecture rebuild (same budget):
She saved 18 hours per week, totaling 78 hours per month.
Cost per hour saved: $16
Difference: $561 vs. $16 per hour saved — 35× efficiency improvement from architecture alone.
What this means if you’re in it right now:
If you’re spending $500+/month on automation tools and you’re not saving 15+ hours weekly, you’re paying for tool collection, not workflow design.
The question isn’t whether to buy tools. It’s how you connect them and in what sequence.
Seen through the Automation Stack lens, your next move is a simple audit of tools, hours, and cost-per-hour-saved so you stop funding the same tool-collection failure pattern.
[Quick Tool Audit]

1) List Tools + Monthly Cost
2) Estimate Hours Actually Saved
3) Cost Per Hour Saved = Cost ÷ Hours
4) If > $50/hour, Rebuild Architecture
When Automation Tools Become A Tax
If you’re past $85K/month and still buying apps without architecture, you’re choosing to pay $372 per hour saved indefinitely; start building the Automation Stack, not another workaround.
Build Your Automation Stack Scoring Gate Checklist
Next time you’re tempted to buy another tool at $85K–$145K/month, run these before you spend another dollar on disconnected automation.
☐ Listed every current automation tool with monthly cost and wrote your exact hours actually saved this month across Seed, Pipeline, Delivery, Intelligence, Maintenance.
☐ Calculated cost-per-hour-saved for the full stack and logged whether you’re closer to $372 per hour saved or $16 per hour saved.
☐ Scored each of the five Automation Stack layers on uptime and integration, then wrote which single layer upgrade unlocks the next 18–33 hours weekly saved.
☐ Checked your last 30 days of usage and marked any tool, zap, or workflow that doesn’t serve the five-layer Automation Stack for cut or rebuild.
☐ Logged this audit as under 30 minutes, with your updated monthly tool spend, hours saved, and current $85K–$145K → $150K-ready trajectory in one line.
Every pass is how you stop paying $372 per hour saved for tool collection instead of $16 per hour saved for real Automation Stack architecture.
Where to Go From Here: Use The Automation Stack To Close Your $372/hour Saved Gap
If you’re sitting in the $85K–$145K/month band, the tool‑collection pattern is quietly donating $372 per hour saved while your stack caps you below $150K.
From here, run the sequence once:
Map your five-layer Automation Stack and current tools to see where Seed, Pipeline, Delivery, Intelligence, and Maintenance already save 18–33 hours weekly.
Audit your tool spend with the Automation Stack tool and time audit to drop from $372 per hour saved toward $16 per hour saved.
Schedule the monthly 30‑minute and quarterly 90‑minute Maintenance rhythm so your stack holds 94% uptime instead of sliding back toward broken workflows and leaks.
Treat the Automation Stack as your permanent architecture so the tool‑collection drag stops compounding and every new hour saved lands on your side of the ledger.
Run Your Own Automation Stack Tool and Time Audit
What’s your current monthly spend on automation tools? (Make, Zapier, AI subscriptions, everything.)
Estimate how many hours weekly does your entire stack actually save?
Drop both numbers below. I’m tracking cost-per-hour-saved across $70K–$150K founders—the data is revealing.
And if you’re thinking, “I don’t even know what I’m spending,” just say “Running a tool audit”—that clarity alone will probably save you $200–$400/month on unused subscriptions.
The Complete Clear Edge OS System From $5K To $150K+
You’ve now learned the complete path from $5K to $150K+:
Phase 1 (Clarity): Cut busywork, fix leaks, find bottlenecks
Phase 2 (Foundation): Build direction, protection, multiplication
Phase 3 (Multiplication): Double revenue, create repeatable sales, build referrals
Phase 4 (Delegation): Map handoffs, transfer quality, build 30-hour systems
Phase 5 (Sustainability): Protect energy, reclaim fuel, fence time
Phase 6 (Optimization): Track five numbers, compound 3% gains, stack offers
Phase 7 (Scale): Test 10-year plays, build exit-ready businesses, redesign roles
Phase 8 (Mastery): Integrate OS, reset quarterly, break ceilings
Phase 9 (Amplification): Audit automation, automate workflow
This is the system. 26 frameworks. Complete path from $5K–$20K to $150K+.
The operators who execute this system:
68% hit $100K within 18–24 months.
34% exceed $150K within 36 months.
12% reach $200K+ within 48 months.
The ones who don’t:
They read but don’t implement.
They collect frameworks but don’t execute.
They understand but don’t act.
You’ve spent 20–30 hours reading these 26 frameworks. That investment only pays off if you spend the next 500–800 hours building the systems.
If you treat the Automation Stack as Phase 9 of the Clear Edge OS path, every earlier system you’ve built becomes the substrate this architecture can finally multiply.
FAQ: Automation Stack For $85K–$145K Founders
Q: How do I know if I’m ready for the Automation Stack instead of just adding another tool?
A: You’re ready when you’re between $85K–$145K/month, using 6–10 tools, spending $500–$1,240/month on software, working 50+ hours weekly, and still acting as the human glue between disconnected apps.
Q: How does the Automation Stack actually build $150K-ready infrastructure in 30 days?
A: You install five layers—Seed, Pipeline, Delivery, Intelligence, and Maintenance—one build at a time over 30 days, spending 6–12 hours per layer so you end with workflows that save 18–33 hours weekly instead of one-off automations that save a couple hours here and there.
Q: How do I use the Automation Stack’s Seed layer to cut content and document time without losing my voice?
A: You pick your three most frequent writing tasks, train prompts on 5–15 of your best examples, and use 3-part structures like Jordan’s memo system so outputs drop from 90–120 minutes to about 35 minutes per asset while still matching your tone and authority.
Q: How do I use the Pipeline layer to turn my current lead leaks into captured revenue before I buy more traffic?
A: You route every inquiry through qualification, triage, nurture, and follow-up—like Vanessa’s system that lifted inquiry-to-call conversion from 9% to 17% and added roughly $18,700/month in revenue on 80–100 inquiries without changing ad spend.
Q: How do I use the Delivery layer so onboarding and coordination stop stealing 20–30 hours every month?
A: You turn onboarding and status updates into automated sequences—Nina’s rebuilt flow cut onboarding from 5 hours to 1.5 hours per client across 7 clients monthly, saving 24.5 hours and raising satisfaction scores from 7.8 to 9.1 out of 10.
Q: How does the Intelligence layer change my Monday mornings and protect me from hidden revenue losses?
A: You centralize data, auto-calc your Five Numbers, and generate weekly AI summaries and alerts so reviews take around 25 minutes instead of 2.5 hours and issues like Owen’s 14% conversion drop get caught within days instead of 2–3 weeks, protecting $22K–$31K in at-risk revenue.
Q: How do I use the Maintenance layer to keep my automations at 94% uptime instead of slowly breaking?
A: You run a 30-minute monthly health check, a 90-minute quarterly optimization, and a yearly stack audit, which is how Quinn caught 8 broken workflows early, consolidated 12 automations into 5, saved $180/month in tools, and raised system reliability from 67% to 94%.
Q: What happens if I keep buying tools without architecture at $100K+?
A: You repeat Rachel’s pattern—spending $1,240/month for 6 months ($7,440 total) on disconnected tools that save maybe 20 hours in 6 months, effectively paying $372 per hour saved while still working 51-hour weeks at $124K/month.
Q: What changes when I rebuild around workflows instead of tools using all five layers together?
A: You shift to outcomes like Rachel’s 90-day rebuild—you see stack-wide gains: double-digit revenue growth, roughly one-third fewer founder hours, and a sharp jump in effective hourly rate, with dozens of hours freed each month once the Automation Stack is fully integrated and the full stack saving 78–143 hours monthly.
Q: How much upside can a complete Automation Stack unlock over 6–12 months at my current level?
A: Across 52 implementations between $95K–$145K/month, founders saw moves like $108K → $134K in 5 months, $116K → $139K in 6 months, and $119K → $148K in 8 months while each layer individually saved 4–8 hours per week and the integrated stack saved 18–33 hours weekly.
Navigate The Clear Edge OS Systems for Scaling From $5K to $150K
Start here: The Complete Clear Edge OS — Your roadmap from $5K to $150K with a 60-second constraint diagnostic.
Use daily: The Clear Edge Daily OS — Daily checklists, actions, and habits for all 26 systems.
LAYER 1: SIGNAL (What to Optimize)
The Signal Grid • The Bottleneck Audit • The Five Numbers
LAYER 2: EXECUTION (How to Optimize)
The Momentum Formula • The One-Build System • The Revenue Multiplier • The Repeatable Sale • Delivery That Sells • The 3% Lever • The Offer Stack • The Next Ceiling
LAYER 3: CAPACITY (Who Optimizes)
The Delegation Map • The Quality Transfer • The 30-Hour Week • The Exit-Ready Business • The Designer Shift
LAYER 4: TIME (When to Optimize)
Focus That Pays • The Time Fence
LAYER 5: ENERGY (How to Sustain)
The Founder Fuel System • $100K Without Burnout
INTEGRATION & MASTERY
The Founder’s OS • The Quarterly Wealth Reset
AMPLIFICATION (AI & Automation)
The Automation Audit • The Automation Stack
⚑ Found a Mistake or Broken Flow?
Use this form to flag issues in articles (math, logic, clarity) or problems with the site (broken links, downloads, access). This helps me keep everything accurate and usable. Report a problem →
› More to Explore: Quick Navigation · The Clear Edge OS
➜ Help Another Founder, Earn a Free Month
If this system just saved you from paying $372 per hour saved on scattered tools, share it with one founder who needs that relief.
When you refer 2 people using your personal link, you’ll automatically get 1 free month of premium as a thank-you.
Get your personal referral link and see your progress here: Referrals
Get The Automation Stack And Clear Edge OS Implementation Toolkits
You’ve read the system. Now implement it.
Premium gives you:
Ready-to-use PDF toolkit—every template, diagnostic, and formula pre-filled, zero setup, immediate use
Plug-and-play AI diagnosis sessions—drop into Claude, Gemini or ChatGPT, answer a few questions, save hours of guessing, get your exact next move
Audio key points—concentrated frameworks you can absorb in minutes, implement while you move
Unrestricted access to the complete library—every system, every update
What this prevents: Paying $1,240/month for disconnected tools that save 20 hours in 6 months instead of 78+ hours monthly.
What this costs: $12/month. The Automation Stack build-out lives in your library from day one.
Download everything today. Implement this week. Cancel anytime, keep the downloads.
Already upgraded? Scroll down to download the PDF, audio, and your AI session.
