
The Automation Audit: Recover the 12 Hours You're Still Doing Manually for $110K–$140K Operators
An Automation Audit inside The Clear Edge OS—MAP, SCORE, SEQUENCE—shows $110K–$140K operators exactly which automations to build, in what order, and what to stop doing manually.


The Executive Summary
Founders between $70K and $150K/month risk leaving $80K–$150K a year on the table by automating inbox zero instead of $500/hour work; a three-move Automation Audit uncovers 40–60 hidden hours of leverage every month.
Who this is for: Founders and operators at $70K–$150K/month who already spend $800–$1,200/month on tools but still work 50+ hours weekly doing “glue” work manually.
The automation gap problem: You automate low-value tasks first, save 3–4 hours weekly, and keep doing 40–60 hours/month of high-value, repeatable work by hand—like Tyler’s 54 hours with a $28,890 monthly opportunity cost.
What you’ll learn: The three-move Automation Audit—MAP, SCORE, SEQUENCE—to target Seed, Pipeline, Delivery, and Intelligence automations and decide exactly what to build next.
What changes if you apply it: You stop automating social posts and start with proposals, onboarding, reporting, and decision support, freeing 43.5 hours/month like Tyler (worth $104,400/year).
Time to implement: Expect 7–30 days to run the audit (a 7-day tracking sprint plus a 30-day build), 2–4 hours weekly, and a 30‑minute monthly loop that locks in 15–20 hours weekly of leverage.
Written by Nour Boustani for $70K–$150K/month founders and operators who want to reclaim 40–60 hours of high-value time without guessing what to automate, overspending on tools, or leaving $80K–$150K a year in manual work on the table.
If the Automation Audit’s $80K–$150K leakage looks like your calendar, stop automating inbox zero—upgrade to premium and run MAP, SCORE, SEQUENCE properly.
› Library Navigation: Quick Navigation · The Clear Edge OS
Why Smart Founders Automate Low-Value Tasks First
Tyler was already at $107K/month with his retention marketing agency, but his calendar still felt full.
So he automated the obvious things: social posts, calendar, expense tracking. He scheduled social posts, set his calendar to run itself, and pushed expense tracking off his plate
Automation tool spend without leverage:
Tool spend: He spent $840/month on tools.
Time actually saved: He saved maybe 3 hours weekly.
Turning point: Then he finally looked at where his time actually went.
That’s when the gap between tools and leverage became hard to ignore.
Where Tyler’s time actually went:
22 hours monthly: Writing custom client proposals
Same structure, different numbers
18 hours monthly: Onboarding new clients
Same questions
Same setup
Same document collection
14 hours monthly: Post-campaign reporting
Pulling data
Formatting insights
Writing summaries
That’s 54 hours of high-value work he could systematize, and at $535/hour capacity ($107K ÷ 200 hours) it represents $28,890 in monthly opportunity cost.
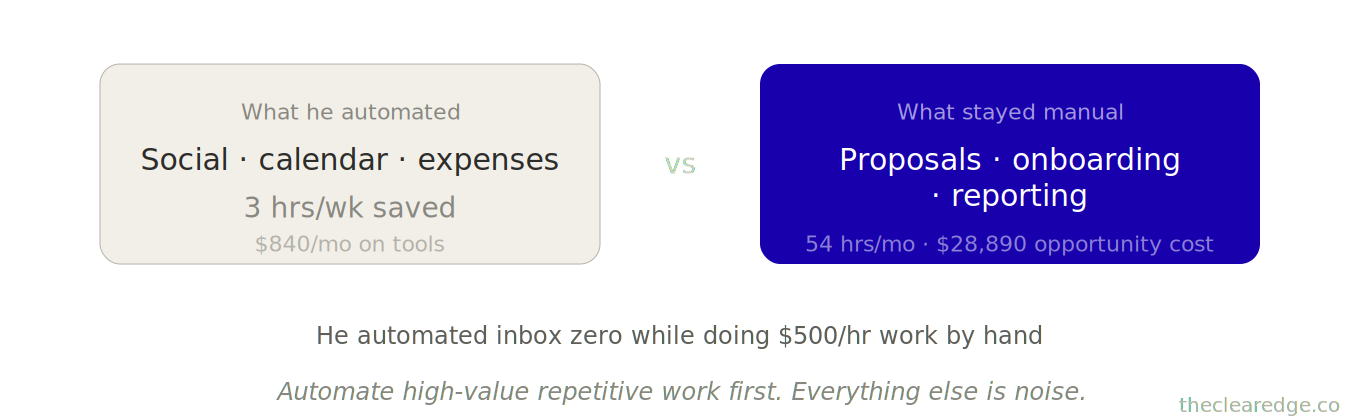
He wasn’t avoiding automation; he was automating inbox zero while still doing $500/hour work manually.
Here’s the pattern that keeps founders stuck at this level.
The Automation Gap Pattern Keeping $70K–$150K/Month Founders Stuck
At every revenue stage, there’s a predictable automation gap
At $70K–$90K/month:
You’ve delegated execution, but founder-dependent tasks (proposals, strategic emails, client QBRs) still require your manual touch.
12–18 hours weekly go to high-value repetitive work.
At $90K–$120K/month:
Your team handles delivery, but coordination tasks (project handoffs, status updates, performance tracking) consume 15–22 hours weekly.
You’re the human bridge between systems, passing information manually that tools could handle.
At $120K+/month:
Systems run, but intelligence tasks (data analysis, pattern recognition, decision support) demand 10–15 hours weekly of founder time.
You’re still the processor, doing the thinking and coordination work that your systems and automations should be handling for you.
The bottleneck isn’t task volume anymore—it’s cognitive load on work that follows patterns.
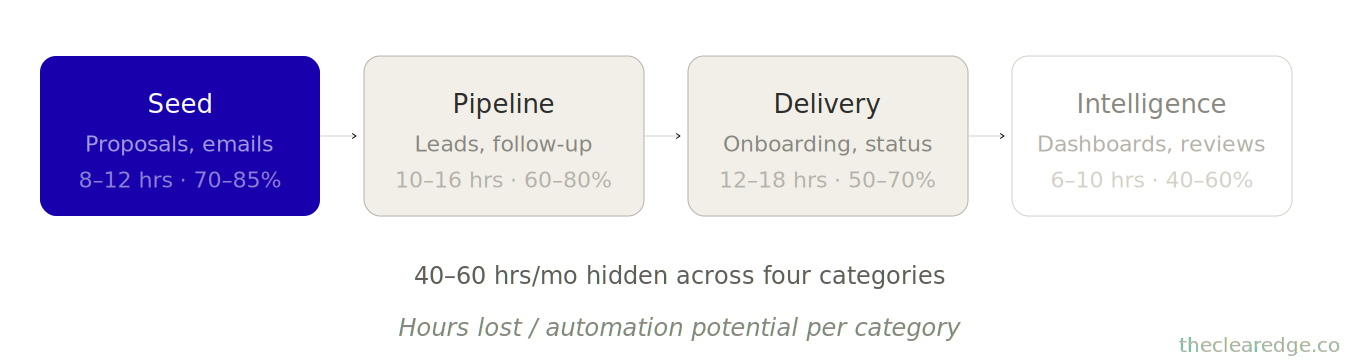
That’s exactly why the Automation Audit breaks your month into Seed, Pipeline, Delivery, and Intelligence work instead of another generic time-management pass.
Where $85K–$140K/Month Founders Lose 40–60 Hours Monthly
Across 47 businesses I’ve audited between $85K and $140K/month, founders lose time in four categories:
Category 1: Seed Work Automation For Emails, Proposals, Strategic Memos
Writing emails, proposals, sales pages, and strategic memos—high‑value outputs that follow templates but still need customization.
Average impact:
Average time lost: 8–12 hours/month
Automation potential: 70–85% (with quality maintenance)
Maya ran a $96K/month brand strategy consultancy, and every proposal took 2.5–3 hours to write as she pulled past case studies, customized frameworks, and matched client language.
She built a proposal-generation system using past winners and AI customization.
New proposal time: 35 minutes.
Math:
Before: 8 proposals monthly × 2.5 hours = 20 hours
After: 8 proposals monthly × 0.6 hours = 4.8 hours
Time saved:
15.2 hours saved per month
15.2 × 12 = 182 hours saved per year
182 × $200 = $36,400 in annual value
Revenue grew from $96K to $118K in 4 months with the same team size, and the real bottleneck was Maya’s proposal calendar blocking sales velocity.
Category 2: Pipeline Automation For Lead Capture, Qualification, Follow-Up
Capturing leads, qualifying prospects, nurturing sequences, and follow-up coordination—the entire gap between inquiry and a booked call.
Average impact:
Average time lost: 10–16 hours/month
Automation potential: 60–80%
Derek’s $89K/month course business had strong inbound but weak follow-up, and 40% of leads never got a response within 48 hours because follow-up was manual.
He automated:
Inquiry → qualification questions → personalized nurture sequence → calendar link.
All triggered by form submission.
Results:
Conversion: 11% → 19% (leads to sales calls)
Time saved: 14 hours/month on manual follow-up
Revenue impact: $89K → $103K in 90 days (same traffic, better conversion)
The automation didn’t just save time—it captured revenue that was leaking through slow response.
Once you see how Seed and Pipeline gains stack, the next move is to treat Delivery and Intelligence with the same MAP, SCORE, SEQUENCE discipline.
Category 3: Delivery Automation For Client Onboarding And Status Updates
Onboarding, status updates, feedback collection, and quality checks—the coordination layer between signing and delivering.
Average impact:
Average time lost: 12–18 hours/month
Automation potential: 50–70% (quality-sensitive)
Priya’s $113K/month web development agency lost time in client onboarding.
Every new client: 4 hours of kickoff meetings, document collection, tool access setup, and expectation setting.
She built an onboarding automation:
Contract signed → welcome sequence (video walkthrough + document checklist) → calendar booking for strategy call → tool access provisioning.
Math:
Before: 4 hours per client × 6 new clients/month → 24 hours
After: 1 hour per client (strategy call only) × 6 clients → 6 hours
Time saved: 18 hours/month
But the bigger win was that client satisfaction jumped because onboarding felt more professional and less chaotic.
Referrals increased 31% in 6 months.
Category 4: Intelligence Automation For Dashboards And Weekly Reviews
Tracking metrics, analyzing performance, identifying patterns, and generating insights—the work your brain does to actually run the business.
Average impact:
Average time lost: 6–10 hours/month
Automation potential: 40–60%
Case — Marcus ran a $128K/month SaaS consulting business.
Every Monday: 2 hours pulling data from 5 different tools, building his Five Numbers dashboard, writing his weekly summary.
He automated dashboard population + AI-generated summary.
His Monday ritual: 20 minutes reviewing automated insights instead of 2 hours building reports.
Time saved: 7.5 hours/month → 90 hours yearly
Results:
He caught bottlenecks faster.
A 14% drop in qualified leads showed up in his automated Monday report.
He pivoted strategy the same week instead of 3 weeks later when he would’ve manually noticed.
The Automation Audit isn’t another tooling checklist—it’s a 30-day way to put hard numbers on the work you still do manually at $110K–$140K/month.
The Automation Audit Framework: MAP, SCORE, SEQUENCE For $110K–$140K Operators
Most founders skip the diagnostic and jump straight to tools, which is why they end up automating low‑value social posts instead of high‑value proposals.
Move 1: MAP — Track 7–30 Days Of Manual Work For Automation Targets
You can’t automate what you don’t measure.
For 30 days, track every task that takes 15+ minutes and repeats monthly, using this format.
Task: [What you did]
Time: [How long it took]
Frequency: [Monthly occurrences]
Pattern Score: [1–10, how repeatable is this?]
Value Score: [1–10, revenue impact if faster/better?]
Pattern Score Guide:
1–3: Unique every time (strategic decisions, crisis management)
4–6: Some patterns (client calls, custom solutions)
7–10: Highly repeatable (proposals, onboarding, reporting)
Value Score Guide:
1–3: Administrative (scheduling, file organization)
4–6: Coordination (status updates, meeting prep)
7–10: Revenue-critical (proposals, client delivery, sales follow-up)
The data was clear: he was spending 6 hours monthly on low-value, high-pattern work (social posts) and 64 hours monthly on high-value, high-pattern work (proposals, onboarding, reporting).
Run MAP Today: Start Your 7-Day Audit
Set up a simple tracking sheet (Notion, Airtable, or Google Sheets).
For 7 days, log every 15+ minute task with pattern/value scores.
At day 7, extrapolate to monthly totals.
You’re not looking for perfection—you’re looking for where 40+ hours hide.
[MAP: 7–30 Days Tracking]
      |
      v
[List of 15+ Minute Tasks]
      |
      v
[Pattern Score + Value Score]
      |
      v
[Monthly Hours by Task]
      |
      v
[Top 3–5 Automation Targets]
When MAP Reveals 40–60 Manual Hours At $110K–$140K/Month
Once MAP exposes 40–60 hours of high-value work you still do by hand at $110K–$140K/month, the next logical move is to upgrade to premium and implement.
Once those 40–60 hours show up in black and white, you can stop guessing and run them through SCORE instead of chasing whatever feels annoying this week.
Move 2: SCORE — Calculate Automation ROI Before You Build
Not every high‑pattern task is worth automating. Some take 40 hours to set up and only save 2 hours a month, which is a 20‑month payback and a terrible ROI.
Use this formula:
Automation ROI = (Monthly Time Saved × Hourly Value × 12) ÷ Setup Cost
Setup Cost Factors:
Seed automation (prompts, templates): 2–5 hours setup
Pipeline automation (Make, Zapier workflows): 5–12 hours setup
Delivery automation (systems integration): 8–20 hours setup
Intelligence automation (dashboards, AI analysis): 6–15 hours setup
Example: Tyler’s proposal automation
Monthly time saved: 15.2 hours
Hourly value: $200 (founder time)
Annual value: 15.2 × $200 × 12 = $36,480
Setup cost: 8 hours to build template library + AI customization → $1,600
ROI: $36,480 ÷ $1,600 = 22.8× return
Payback period: 0.5 months
Compare to his social post automation:
Monthly time saved: 4 hours (went from 6 → 2 hours)
Annual value: 4 × $200 × 12 = $9,600
Setup cost: $840/year tool subscription + 3 hours setup → $1,440
ROI: $9,600 ÷ $1,440 = 6.7× return
Payback period: 1.8 months
Both have positive ROI, but proposals delivered 3.4× better return and faster payback.
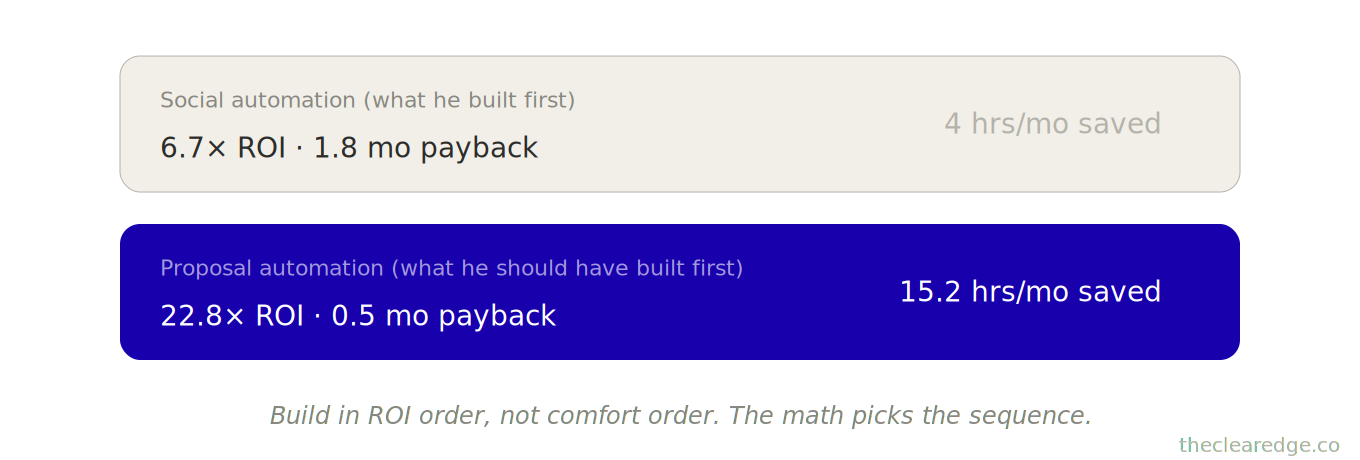
The math told him to build proposal automation first, not social automation—yet he did it backwards because social “felt easier.”
Edge case: What if you don’t have setup time?
Buy it.
Tyler hired a Make specialist for $2,400 to build his onboarding workflow.
The project paid for itself in 2.5 months.
By month 6, he’d saved $17,100 in founder time and closed 2 extra clients because onboarding no longer bottlenecked sales.
Run SCORE Today: Rank Your Top 10 Automation Candidates By ROI
Take your top 10 time-consuming tasks from Move 1.
Estimate setup cost (hours × your rate OR outsource cost).
Calculate annual savings (monthly hours saved × 12 × your rate).
Rank by ROI, not ease.
[All Tasks Ranked by ROI]
        |
        v
[Pick #1, #2, #3]
        |
        v
[Month 1: #1]

[Month 2: #2]

[Month 3: #3]
        |
        v
[43.5+ Hours Freed Monthly]
Move 3: SEQUENCE — Build Automations In Revenue Order, Not Comfort Order
Most founders automate in this order:
What’s easiest (social posts, calendar)
What’s annoying (inbox management)
What actually matters (proposals, onboarding)
Build backwards: highest ROI first, even if it’s harder.
Tyler’s build sequence (based on ROI + dependencies)
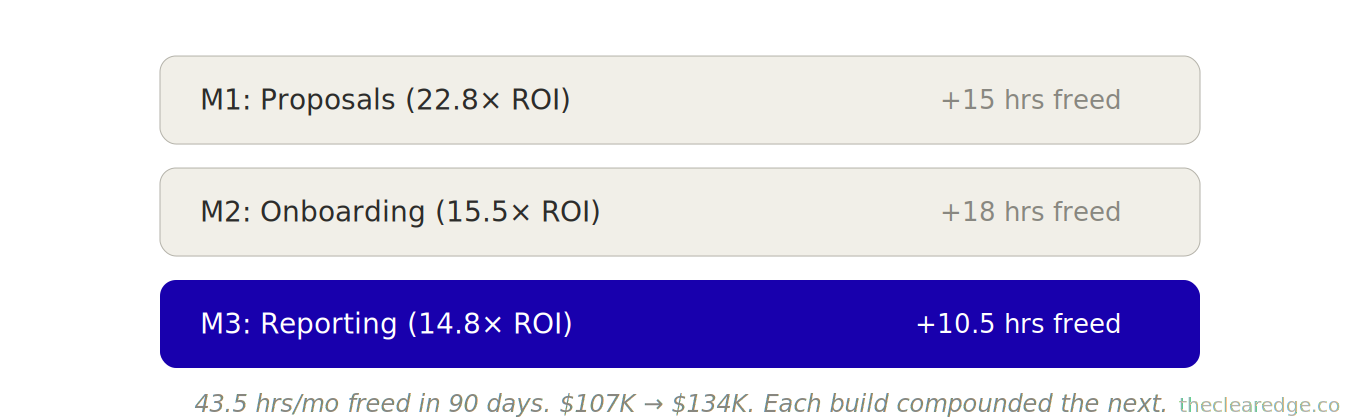
Month 1: Proposals (22.8× ROI)
Week 1: Audit past 20 winning proposals, extract patterns.
Week 2: Build template library (intro, frameworks, case studies, pricing).
Week 3: Create AI customization prompts (client research → proposal).
Week 4: Test with 3 real proposals, refine.
Result: Proposal time dropped from 2.5 hours to 35 minutes, freeing 15 hours of founder time every month immediately.
Month 2: Onboarding (15.5× ROI)
Week 1: Map current onboarding steps (12 manual touchpoints).
Week 2: Build automated sequence (welcome video → document checklist → calendar booking).
Week 3: Set up tool provisioning (automatic access to Slack, project management, file storage).
Week 4: Test with 2 new clients, gather feedback.
Result: Onboarding time 4 hours → 1 hour per client. Freed 18 hours/month.
Month 3: Reporting (14.8× ROI)
Week 1: Standardize report format across all clients.
Week 2: Build data pull automation (connect ad platforms, analytics, CRM).
Week 3: Create AI insight generation (turn data into strategic recommendations).
Week 4: Test with 5 clients, refine templates.
Result: Reporting time dropped from 2 hours to 30 minutes per report, freeing 10.5 hours of founder time every month.
Cumulative impact after 90 days:
Time freed: 43.5 hours/month → 522 hours/year
Annual value: $104,400 (at $200/hour)
Revenue growth: $107K → $134K/month (same team)
The sequence mattered. Proposals freed sales velocity, which increased new client volume, which in turn made onboarding automation more valuable, so each automation compounded the next.
That compounding is fragile though, which is why you need guardrails for what breaks the sequence before you stack more complexity on top.
Automation Sequence Failure Modes to Prevent Stalled Builds
Failure Mode 1: Building complex before simple.
What happened: Derek tried to automate his entire funnel at once—lead capture, qualification, nurture, sales, and onboarding. It took 60 hours to set up, half of it worked, and he abandoned the build.
Why it fails: Too many moving parts, no quick win to reinforce the effort, and when something breaks it’s almost impossible to debug where the fault lives.
The fix: Automate one segment completely, then move to the next. Derek rebuilt by starting with lead qualification only—8 hours of setup, results in week 2, and enough confidence to keep stacking automations.
Failure Mode 2: Automating before systematizing.
What happened: Maya tried to automate proposals before she had a template system, so the automation pulled from chaos and generated more chaos.
Why it fails: Automation amplifies inconsistency when the underlying source material isn’t standardized.
The fix: She spent 3 weeks building her template library first (past winners, frameworks, case studies), then spent 8 hours implementing automation, and the system worked because the source material was clean.
Failure Mode 3: No maintenance plan.
What happened: Marcus automated his dashboard, then ignored it for 8 months. Integrations broke, data stopped flowing, and the dashboard showed 4‑month‑old metrics.
Why it fails: Unchecked automations quietly decay over time and start feeding you bad data, which leads to slow or wrong decisions.
The fix: He added monthly 30‑minute health checks to review automation performance, caught breaks early, and kept the dashboard reliable.
Once you experience one clean 4-week sprint that frees 10–20 hours, it becomes obvious how much $80K–$150K/year depends on doing this in a fixed rhythm.
What Changes In Revenue And Hours When Automation Targets High-Value Work
1. Revenue grows without a proportional increase in time.
Tyler now earns $107K per month in revenue and works 52 hours per week. His effective hourly value at this stage is $206.
After automation, Tyler earns $134K per month in revenue while working 38 hours per week. His effective hourly value rises to $350.
Control increases because founder time shifts from execution to oversight.
Priya freed 18 hours per month from onboarding and reinvested 6 of those hours into higher‑leverage strategic client work.
Her proposal win rate increased from 31% to 44% once onboarding automation removed friction for new clients.
Across 47 businesses that automated strategically:
$89K → $119K in 6 months (course creator, automated pipeline + delivery)
$96K → $127K in 5 months (consultant, automated proposals + intelligence)
$113K → $143K in 7 months (agency, automated onboarding + reporting)
The pattern is always the same: high-value repetitive work becomes systematized, founder time shifts to revenue multipliers.
The Real Cost Of Skipping An Automation Audit At $85K–$140K/Month
Here’s what I need you to understand: every month you manually do high‑value, repetitive work, it costs you real revenue.
Take Tyler at $107K/month, spending 54 hours each month on work that could be automated; at $535/hour capacity, that’s $28,890 in monthly opportunity cost.
If he’d built these automations 6 months earlier:
6 months × $28,890 = $173,340 in freed capacity
Deploying that capacity into sales and strategy delivers 2 to 3 additional clients, which translates into $48K to $72K in actual revenue.
Total cost of waiting: $173K+ in opportunity + $50K+ in lost revenue.
Doing that $500/hour work manually isn’t theoretical—it is exactly what it costs you when automation could handle 70% of it.
If you’re at $85K+/month right now and you’re not systematically auditing automation opportunities, you’re leaving $80K–$150K annually on the table.
So the real question isn’t whether to automate—it’s which work to automate first and how quickly you can deploy it.
When Automation Misses The Real Work
If MAP, SCORE, SEQUENCE never touch your repeatable $500/hour work, you’re protecting comfort, not profit; aim the audit where 40–60 hours actually live.
Map Your Automation Audit Scoring Gate Checklist
Keep this visible. Pull it out every time you’re about to add another tool, hire, or workweek hour instead of expanding MAP, SCORE, SEQUENCE on your $110K–$140K manual load.
☐ Mapped all tracked 15+ minute tasks with Pattern and Value scores and wrote your top 3–5 Seed, Pipeline, Delivery, Intelligence automation targets.
☐ Calculated Automation ROI for those targets using annual savings ÷ setup cost and logged any 20-month payback candidates you’ll cut or delay.
☐ Ranked the top 10 tasks by ROI, recorded your Month 1, Month 2, Month 3 builds, and circled the single #1 automation you’ll ship next.
☐ Checked today’s build against the SEQUENCE guardrails and wrote “standardized, small scope, maintenance scheduled” or flagged which condition fails before you start.
☐ Logged this audit pass under a strict 30‑minute window and wrote the current monthly 40–60 manual hours and $80K–$150K leakage you’re closing.
Every pass is how you stop doing $500/hour work manually while $28,890+ in monthly opportunity cost keeps compounding.
Where to Go From Here: Use The Automation Audit To Stop Donating $80K–$150K In Manual Work
At $70K–$150K/month, the Automation Gap pattern has you doing 40–60 hours of repeatable, high‑value work by hand while leaking $80K–$150K/year.
From here, run the sequence once:
Map your 7–30 day manual workload with MAP so your top 40–60 monthly hours of Seed, Pipeline, Delivery, and Intelligence work show up in black and white.
Score your top 10 tasks with SCORE using the Automation ROI formula so proposal, onboarding, and reporting builds beat low‑leverage social and inbox automations on return.
Sequence your next 90 days with SEQUENCE so you stack 3 automation sprints that free 43.5 hours/month and unlock up to $104,400/year in founder capacity.
Run the Automation Audit as a standing cadence so the manual‑work leak stops compounding and the $80K–$150K shortfall closes instead of widening every quarter.
Start Your Own Automation Audit In The Next 7 Days
Look at your calendar for the past 7 days. What 3 tasks took 2+ hours each and followed a repeatable pattern?
Drop them below. I read every reply, and I’m tracking what founders at $70K-$150K are still doing manually—it shapes what I write next.
And if you’re thinking, “I don’t know what’s automatable yet,” just say, “Starting the 7-day audit”—that awareness alone puts you ahead of founders who keep automating inbox zero while writing $30K proposals by hand.
FAQ: How To Run The Automation Audit For $70K–$150K/Month Businesses
Q: How do I know if the Automation Audit is worth running in my $70K–$150K/month business?
A: It’s worth running when you’re between $70K and $150K/month, already spending $800–$1,200/month on tools, still working 50+ hours weekly, and suspect at least 20–40 of those hours follow repeatable patterns.
Q: How does the Automation Audit actually find the 40–60 hours of leverage I’m still doing manually?
A: It uses three moves—MAP, SCORE, and SEQUENCE—to track every 15+ minute task for 30 days, calculate true automation ROI, and then build in revenue order so you uncover blocks like Tyler’s 54 manual hours and $28,890 monthly opportunity cost.
Q: How do I use MAP to see where my real automation gaps are instead of guessing?
A: For 7–30 days you log each 15+ minute task with pattern and value scores, then extrapolate to monthly totals so patterns like Tyler’s 64 hours on high-value, high-pattern work versus 6 hours on low-value tasks become obvious targets.
Q: How do I use SCORE to decide which tasks to automate first without wasting 40 hours on low-return builds?
A: You estimate setup cost and annual savings for your top 10 tasks, then rank them by the Automation ROI formula so moves like Tyler’s proposal system with 22.8× ROI beat social-post automation with only 6.7× ROI.
Q: How do I use SEQUENCE so my automation builds stack like Tyler’s instead of stalling like Derek’s?
A: You schedule 4-week sprints and implement automations in ROI order—proposals, onboarding, reporting—so you free 43.5 hours/month in 90 days instead of trying to automate the entire funnel at once and abandoning a 60-hour build.
Q: How do I apply the Automation Audit to Seed work like emails and proposals without losing quality?
A: You mine 20 winning examples, extract patterns, build templates, and train AI prompts so proposal time drops from 2.5–3 hours to about 35 minutes like Maya, saving 15.2 hours/month and unlocking $36,400 in annual value at $200/hour.
Q: How does the Automation Audit change Pipeline work like lead follow-up and qualification?
A: You identify leaks between inquiry and booked call, then build automations that collect qualification data and trigger nurture sequences, turning situations like Derek’s 40% un-contacted leads into 11%→19% conversion jumps and $89K→$103K in 90 days on the same traffic.
Q: How do I use the framework on Delivery work like onboarding and reporting without breaking client experience?
A: You standardize steps, then automate the predictable parts—welcome sequences, document collection, access provisioning, and report generation—so onboarding drops from 4 to 1 hour per client like Priya, saving 18 hours/month and increasing referrals by 31% in 6 months.
Q: How does the Automation Audit handle Intelligence work like dashboards and weekly reviews?
A: You automate data pulls and AI summaries so Monday reviews shrink from 2 hours to about 20 minutes, as in Marcus’ case, saving 7.5 hours/month while catching issues like a 14% lead drop within a week instead of 3 weeks later.
Q: How much does delaying this audit actually cost a founder between $85K and $140K/month?
A: For someone like Tyler at $107K/month, 54 manual hours at $535/hour capacity equals $28,890 in monthly opportunity cost—waiting 6 months to automate means leaving more than $173K in capacity plus $50K+ in lost revenue on the table.
Up Next: The Automation Stack For Building Your $150K Business Infrastructure
The next article covers “The Automation Stack: Build Your $150K Business Infrastructure in 30 Days for $125K–$150K Operators.” I will show you how to build automation—the exact tool stack, workflows, and prompts that cut 15-20 hours weekly.
Navigate The Clear Edge OS Systems for Scaling From $5K to $150K
Start here: The Complete Clear Edge OS — Your roadmap from $5K to $150K with a 60-second constraint diagnostic.
Use daily: The Clear Edge Daily OS — Daily checklists, actions, and habits for all 26 systems.
LAYER 1: SIGNAL (What to Optimize)
The Signal Grid • The Bottleneck Audit • The Five Numbers
LAYER 2: EXECUTION (How to Optimize)
The Momentum Formula • The One-Build System • The Revenue Multiplier • The Repeatable Sale • Delivery That Sells • The 3% Lever • The Offer Stack • The Next Ceiling
LAYER 3: CAPACITY (Who Optimizes)
The Delegation Map • The Quality Transfer • The 30-Hour Week • The Exit-Ready Business • The Designer Shift
LAYER 4: TIME (When to Optimize)
Focus That Pays • The Time Fence
LAYER 5: ENERGY (How to Sustain)
The Founder Fuel System • $100K Without Burnout
INTEGRATION & MASTERY
The Founder’s OS • The Quarterly Wealth Reset
AMPLIFICATION (AI & Automation)
The Automation Audit • The Automation Stack
⚑ Found a Mistake or Broken Flow?
Use this form to flag issues in articles (math, logic, clarity) or problems with the site (broken links, downloads, access). This helps me keep everything accurate and usable. Report a problem →
› More to Explore: Quick Navigation · The Clear Edge OS
➜ Help Another Founder, Earn a Free Month
If this system just saved you from leaving $80K–$150K a year in manual work on the table, share it with one founder who needs that relief.
When you refer 2 people using your personal link, you’ll automatically get 1 free month of premium as a thank-you.
Get your personal referral link and see your progress here: Referrals
Get The Automation Audit Toolkit
You’ve read the system. Now implement it.
Premium gives you:
Ready-to-use PDF toolkit—every template, diagnostic, and formula pre-filled, zero setup, immediate use
Plug-and-play AI diagnosis sessions—drop into Claude, Gemini or ChatGPT, answer a few questions, save hours of guessing, get your exact next move
Audio key points—concentrated frameworks you can absorb in minutes, implement while you move
Unrestricted access to the complete library—every system, every update
What this prevents: Leaving 40–60 hours monthly and $80K–$150K yearly trapped in manual, high-value, repeatable work.
What this costs: $12/month. Access the full Automation Audit toolkit that matches the MAP, SCORE, SEQUENCE system in this article.
Download everything today. Implement this week. Cancel anytime, keep the downloads.
Already upgraded? Scroll down to download the PDF, audio, and your AI session.
